Author: Sissel Martinsen
The Lohrenz-Bray-Clark (LBC) correlation is the compositional viscosity correlation most used in the upstream petroleum industry. It is a relatively simple model, consistent for both gas and oil phases (also near critical conditions). With proper application of the LBC model involving (a) careful selection of component critical volumes for C7+ fractions and (b) slight tuning of the LBC model parameters, oil, gas, and near-critical viscosities can be calculated with accuracy close to measurement error (±5-15% for oil viscosities and ±2-5% for gas viscosities). However, without tuning, the LBC correlation predicts poor oil[1] viscosities. At the end of this article we show a field example illustrating this.
The LBC correlation has five coefficients and uses critical volumes to calculate viscosity. Tuning of the LBC viscosity model is normally done by adjusting the critical volumes of the C7+ components and/or the LBC coefficients. The drawback of the LBC correlation is that the default critical volumes from an EOS is normally not a good starting point for the regression. Usually the default critical volumes will predict non-monotonic increasing viscosities with molecular weight, as shown below in Figure 1.
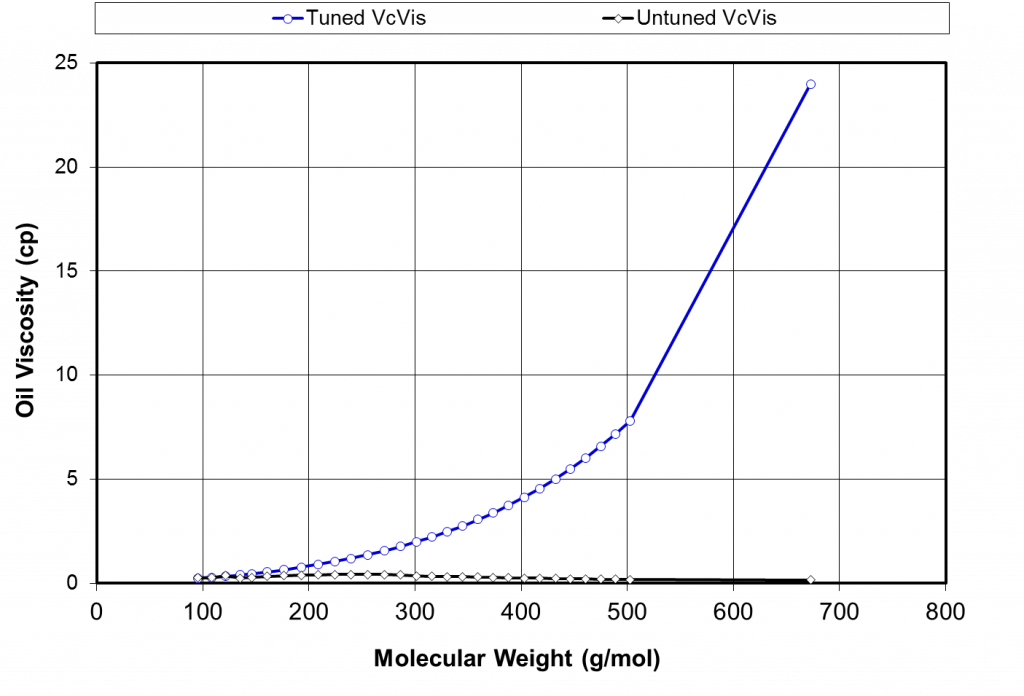
The non-monotonic oil viscosities may result in problems in component sensitive processes like condensate dropping out in gas condensate reservoirs or in injection processes.
It should also be noted that adjusting the five coefficients in the LBC correlation can lead to non-physical component viscosities. Since it is a 4th order polynomial, unrestricted and careless tuning may result in strange non-monotonic, non-physical shaped function which can lead to gas viscosity estimations that are higher than the predicted oil viscosities.
We suggest following procedure to obtain a good viscosity model for gas condensate reservoirs using the LBC correlation:
- Measure oil viscosity on a separator oil at reservoir temperature and pressures. It is difficult / expensive to obtain retrograde condensate sample for measuring oil viscosity. The use of separator oil brought to reservoir conditions will give adequate data to ensure accurate tuning of the LBC correlation for “a related condensate” phase.
- Use the Orrick and Erbar[2] correlation to estimate the viscosities of each component in the C7+ fraction at reservoir temperature and atmospheric pressure. This is done to ensure monotonically increasing component viscosities with increasing molecular weight, and to get good starting point values for the critical volumes of the EOS model. A reduced temperature should be used for the lighter components if the reservoir temperature is higher than the normal boilingpoint of the respective components to make sure all components are in liquid state. Component molecular weights and specific gravities of the C7+ components are taken from the latest EOS (prior to viscosity fit). The method of Orrick and Erbar computes the component viscosities from this data and the temperature.
- Tune the critical volumes to give an exact match of the calculated single component viscosities.
- Further tuning to match measured oil viscosities may be done by a common shift in critical volumes of all C7+ components.
- If more tuning is needed, the LBC coefficients may be adjusted. We suggest regressing on the two last coefficients. A plot should be made to ensure that viscosity versus reduced density is a monotonic function.
- Oil and gas viscosities should be matched simultaneously. This is especially important if the LBC coefficients are being adjusted.
LBC model verification is important, and we always follow a step-by-step validation – whether we have followed the procedure given above, or when using an LBC model developed by someone else.
- For each & every C7+ fraction (Cx), run your PVT software using a feed that is set to 100% Cx, calculating the oil viscosity at reservoir (relevant) temperature and one atmosphere[3]. Two physical constraints are considered: (a) the viscosities of each fraction should be monotonically increasing, or very nearly so, and (b) the heaviest fraction should always have the highest viscosity. If not, the LBC model should be redone following the procedure above.
- Plot the fourth-degree polynomial (right hand side) of the LBC reduced density correlation using the five LBC constants (original or tuned). The function should be (a) monotonically increasing with reduced density, and (b) very similar to the original LBC (JST) correlation at lower reduced densities (𝜌r<0.5) describing gaseous fluids.
- Simulate a constant composition expansion and make sure that saturated oil viscosities are always higher than saturated gas viscosities at the same pressure.
If any of the criteria above are violated, a new LBC model should be built using the recommended procedures given earlier (Yang et al[4] present a paper on LBC viscosity modeling which is recommended and follows the guidelines given here).
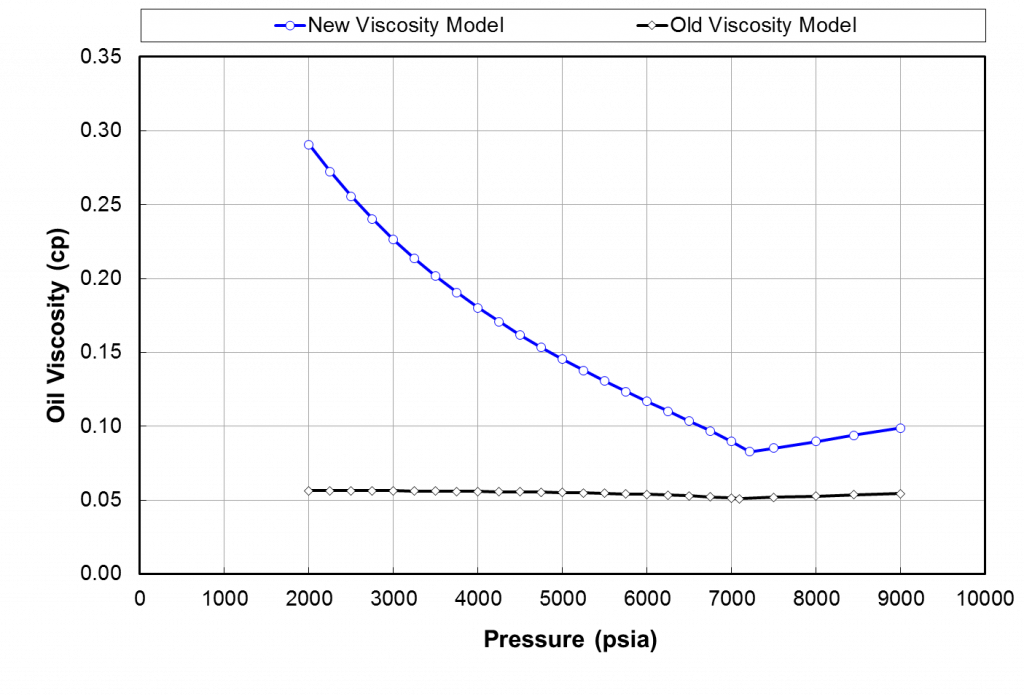
An example LBC model validation is given to illustrate some common problems with inadvertent LBC modeling. We recently completed a study where we provided EOS and fluid initialization for a rich gas condensate field. The client had already developed an EOS/viscosity model that predicted all reported PVT data, including reported gas viscosities, with reasonable accuracy. The viscosity model used was the LBC correlation, with the unusual (nearly constant) oil viscosities shown in Figure 2. The old viscosity model predicted oil viscosities of approximately 0.05 cp for all pressures, which is unrealistic. The reason for the low viscosity is that the old model was only tuned to match reported gas viscosities.
As part of the recalibration of the viscosity model, we updated the critical volumes used in the LBC correlation based on the Orick-Erbar correlation and methods discussed earlier.
With the updated viscosity model, a large difference in the calculated flowing BHPs from a reservoir simulation was observed (up to 3000 psi difference) – based on the Old Viscosity Model versus the New Viscosity Model. It was determined that the large change in flowing BHPs was due to the updated LBC viscosity model predicting higher (more realistic) oil viscosities than the old viscosity model.
[1] In this article the term “oil” refers to a liquid condensate phase.
[2] Reid, R.C., Prausnitz, J.M., and Polling, B.E.: “The Properties of Gases and Liquids,” Fourth Edition, McGraw-Hill Book Co. Inc., New York City (1987) 388-485, Section 9-11.
[3] The same pressure should be used for each C7+ component (usually 1 atm), but it must be higher than the lightest C7+ fraction’s vapor pressure (bubblepoint).
[4] Yang, T., Fevang, Ø., Christoffersen, K., and Ivarrud, E. “LBC Viscosity Modeling of Gas Condensate to Heavy Oil,” SPE 109892, 2007.
Learn more about our consulting capabilities
###
Global
Curtis Hays Whitson
curtishays@whitson.com
Asia-Pacific
Kameshwar Singh
singh@whitson.com
Middle East
Ahmad Alavian
alavian@whitson.com
Americas
Mathias Lia Carlsen
carlsen@whitson.com
About whitson
whitson supports energy companies, oil services companies, investors and government organizations with expertise and expansive analysis within PVT, gas condensate reservoirs and gas-based EOR. Our coverage ranges from R&D based industry studies to detailed due diligence, transaction or court case projects. We help our clients find the best possible answers to complex questions and assist them in the successful decision-making on technical challenges. We do this through a continuous, transparent dialog with our clients – before, during and after our engagement. The company was founded by Dr. Curtis Hays Whitson in 1988 and is a Norwegian corporation located in Trondheim, Norway, with local presence in USA, Middle East, India and Indonesia