Author: Erlend Torheim
It is important to understand and model the reduction in well deliverability due to condensate blockage in gas condensate wells. Failing to do so can lead to inappropriate design of (a) well completion, (b) number of wells required for development, and (c) compression requirements – all having a significant bottom-line impact on project economics.
Many petroleum engineers have heard about “condensate blockage” (or the less-appropriate expression “condensate banking”), without necessarily understanding the phenomenon and how to deal with it. This short article aims to highlight some important issues about condensate blockage.
What is condensate blockage?
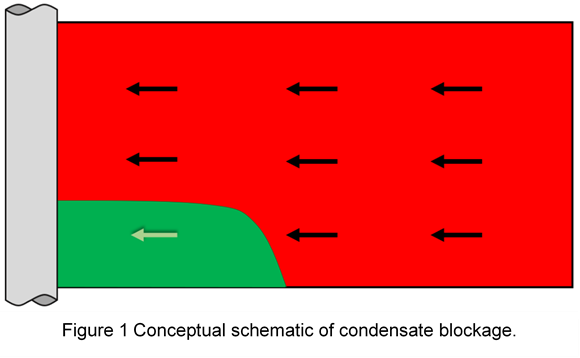
Condensate blockage is the reduction in gas mobility near and away from the wellbore. It starts when flowing bottomhole pressure (FBHP) drops below the dewpoint pressure. Gas relative permeability decreases as a mobile condensate saturation (So>Soc) is established near the well due to retrograde condensation. The condensate blockage region (“Region 1”) can extend a few feet to hundreds of feet away from the wellbore. Region 1 is characterized by steady-state flow where the gas-oil fluid mixture produced into the wellbore is identical with the gas-oil flowing mixture throughout the blockage region.
Figures 1 and 2 show schematically a well experiencing condensate blockage. The profiles shown are equally applicable to any well geometry (vertical unstimulated, hydraulically fractured, or horizontal hydraulically fractured), where the distance axis is in the direction of flow towards the well. Gas relative permeability loss in the blockage region can range from krg of 0.3 to 0.03, depending mainly on (a) rock relative permeability curves and (b) richness of the producing wellstream, i.e. producing condensate-gas ratio (rp or CGR). Poorer quality rock and richer producing wellstream result in a lower value of krg in Region 1.
Everywhere within the condensate blockage region, the condensate phase is mobile with saturation So>Soc, for all times and regardless of how lean or rich the producing wellstream. The oil mobility in the blockage region is controlled by the ratio krg/kro which may range from krg/kro=0.1 for a rich condensate (~300 STB/MMscf) to krg/kro=100 for a lean condensate (~20 STB/MMscf), respectively. As an example, a well with 200 STB/MMscf and FBHP=1000 psia, krg=0.1 and krg/kro=1 might be expected. This would mean that krg=kro~0.1 throughout the entire condensate blockage region. As the producing CGR decreases during depletion (average reservoir pressure drops below the dewpoint), both the krg and krg/kro values will increase. For example, a decrease to rp=100 STB/MMscf might lead to krg=0.2 and krg/kro=10, resulting in an oil relative permeability in the blockage region of kro=0.02 (=0.2/10).
When is condensate blockage important?
The condensate blockage of a well (as all “damage”) is important only when the well can no longer deliver its target rate. That is, when the choke is fully open and a surface facility pressure (usually separator pressure) constrains the well’s deliverability and causes the well rate to decline. At this point, the FBHP is at a minimum and will remain so thereafter. Thus, we need to understand and engineer condensate blockage only after the well reaches this minimum FBHP. For most fields, the surface-constrained minimum FBHP will range from 250 to 1500 psia.
A rule of thumb that often applies to conventional gas condensate wells is that the condensate blockage pressure drop is approximately the same magnitude as the total reservoir pressure drop if the well was producing dry gas (i.e. without condensate blockage). That is, the productivity index is reduced at least by a factor of 2 (blockage “skin” of 5-10) when compared with the performance of a dry gas well. For a rich condensate and poor rock quality, the productivity index might be reduced by a factor of 3 or more (blockage skin>20). The magnitude of blockage skin will decrease with degree of undersaturation (when minimum FBHP is reached).
To establish whether condensate blockage has a bottom-line effect, the magnitude of pressure drop in the reservoir must be compared with the total pressure drop in the well – i.e. from the outer boundaries of the reservoir to the tubinghead (which is constrained by surface facilities). For high-kh wells (kh>10,000 md-ft) the majority of total well pressure drop is likely caused by friction in the tubing, and the blockage pressure drop may have only a minor impact on well deliverability.
As an example, consider a high-kh well with pressure drop in the tubing of 2000 psi just when the tubinghead pressure reaches the separator pressure constraint and the well goes on decline. At this condition, if the total reservoir pressure drop is only 100 psi, of which 50-80 psi is due to condensate blockage, we would conclude that blockage (a) has a significant impact on reservoir pressure drop, but (b) has no bottom-line impact on well deliverability.
In conclusion, condensate blockage is always important to well deliverability and field development planning when the total reservoir pressure drop is “significant” at the time a well reaches its minimum FBHP and the well goes on decline. There are many ways to quantify “significant”, but the simplest is to model the rate-time performance of your wells/reservoir using dry gas and appropriate tubing pressure-loss tables. Then run two additional cases with a “blockage damage skin” of +5 and +20. If the three rate-time profiles differ significantly in terms of economic assessment, then condensate blockage should be understood and modeled properly.
How do we model condensate blockage?
We have three methods to model condensate blockage:
- As discussed above using a simple condensate blockage skin of magnitude +5 to +20 with dry gas flow treatment in the reservoir and tubing. This should give a first-order correct assessment of whether condensate blockage is important or not.
- Finely-gridded, single-well model of the actual well geometry (a) vertical or horizontal unstimulated well using r-z coordinate with geometric gridding in the radial direction (with smallest grids at the wellbore, increasing in size by a constant outwards), or (b) stimulated hydraulically fractured well with complex gridding and very-small grid sizes near the hydraulic fracture and increasing in size into the reservoir. This model should always be the most accurate method to quantify condensate blockage, and the near-well grid sizes are often in the range of inches.
- Coarse-grid, single-well or full-field models using the Fevang-Whitson generalized pseudopressure function (“GPP” option in ECLIPSE simulators E100 and E300). Any well geometry is treated accurately by the well index term (see Fevang and Whitson[1]).
In our experience, methods 2 and 3 almost always give the same accuracy for modeling condensate blockage throughout the life of a well. The only caveat is that method 3 may require grids surrounding a well to be somewhat smaller than the coarsest grids – e.g. Dx=Dy=50-100 ft near-well grids for a lean gas condensate (<50 STB/MMscf), with Dx=Dy~300 ft near-well grids for richer condensates (>100-200 STB/MMscf).
Local grid refinement in a full-field model without the Fevang-Whitson pseudopressure method is seldom adequate to quantify condensate blockage without an impractical number of small near-well grids.
A reservoir simulator without the pseudopressure method implemented cannot model condensate blockage accurately using conventional full-field coarse gridding. Some companies use method 1 (blockage skin) as an approximate method, and this is certainly better than ignoring the blockage effect. Another more-general solution, albeit convoluted, is to include the Fevang-Whitson method as a pseudo-tubing table.
What is important in modeling condensate blockage?
(1) Rock gas-oil relative permeabilities and (2) proper PVT modeling of saturated phase properties, particularly near the minimum FBHP.
The three-region model presented by Fevang and Whitson in 1995[1] gives an accurate method for gas condensate wells to relate the gas rate to FBHP – i.e. the “rate equation”, “inflow performance relation (IPR)” or as Mike Fetkovich calls it “reservoir contribution to the gas well deliverability”. The method is simply a constant C times a gas-oil pseudopressure integral,
$$ q_g=C\int_{p_{wf}}^{p_R}{{\ M}_g\left(p\right)dp} \tag{1}$$
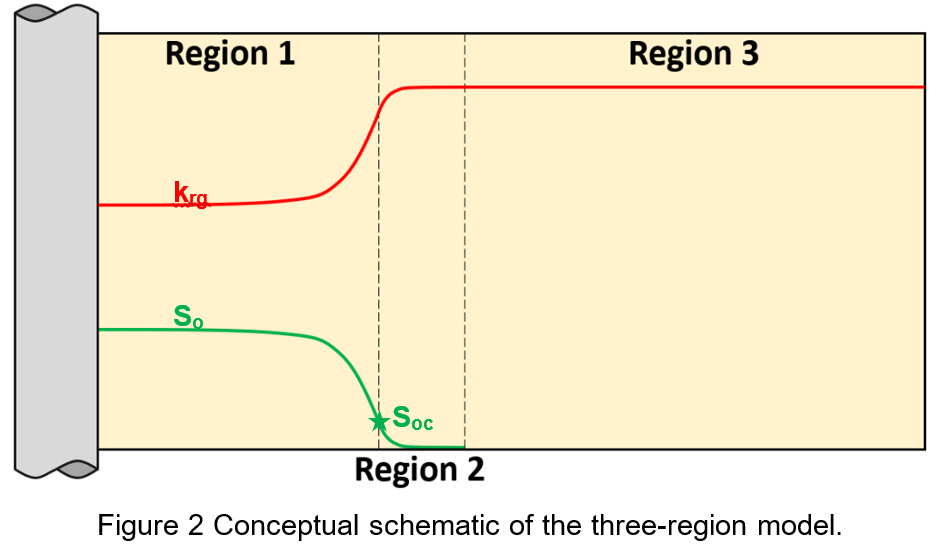
where Mg = gas mobility. The constant C includes kh, well geometry factors like ln(re/rw) and skin related to formation damage or stimulation. The pseudopressure integral has three pressure regions as illustrated in Figure 2, consisting of:
- Region 1: An inner near-wellbore region where both gas and condensate flow simultaneously – the “condensate blockage” region.
- Region 2: A region of condensate buildup where only gas is flowing (So<Soc).
- Region 3: A region containing single phase (original) reservoir gas.
An important observation is that the flowing mixture throughout Region 1 is constant and equal to the produced wellstream. This follows because Region 1 is at “steady state”, meaning that net condensate accumulation is zero and the saturated gas phase entering from Region 2 flows without change throughout Region 1. The phase mobility profiles Mo(x) and Mg(x) away from the wellbore in Region 1 are maintained to ensure the steady-state flow condition. This fundamental behavior was first discussed by Evinger and Muskat in 1942 (for solution gas drive wells).
The main deliverability loss occurs in Region 1 is due to reduction in gas relative permeability. As shown by the Evinger-Muskat work, pressure dependence of gas relative permeability needed to evaluate the gas mobility term Mg(p)=krg(p)/ug(p)Bgd(p), is found from the relationship krg(p)=f[krg/kro(p)]. The gas-oil relative permeability ratio krg/kro can be expressed in terms of pressure-dependent PVT properties and producing GOR (Rp=1/rp),
$$ \frac{k_{rg}}{k_{ro}}\left(p\right)=\left(\frac{R_p-R_s}{1-r_sR_p}\right)\frac{\mu_gB_{gd}}{\mu_oB_o}\ \tag{2}$$
Eq. (2) can also be expressed in terms of oil relative volume of the producing wellstream from a simple flash (e.g. from a CCE experiment), where VroCCE = Vo/(Vo + Vg).
$$ \frac{k_{rg}}{k_{ro}}\left(p\right)=\left(\frac{1}{V_{roCCE}}-1\right)\frac{\mu_g}{\mu_o} \tag{3}$$
The pseudo-pressure integral for Region 1 is solved by calculating the krg/kro(p) relationship from the FBHPto p* (=dewpoint of the wellstream), and finding the corresponding krg and kro values from the relative permeability relation krg(p)=f[krg/kro(p)].
This emphasizes the importance of using appropriate relative permeabilities for Region 1. Measurements should be made using a steady-state gas-oil system and, interestingly, the conventional kr(S) relationship is not important, but instead the relationship krg(krg/kro). Saturations do not need to be measured to determine the krg(krg/kro) relationship controlling condensate blockage.
In the 1990s laboratory tests showed that high flow velocities (v) found in conventional vertical wells near the wellbore could lead to an improvement in krg. The capillary number Nc
$$ N_c=\frac{v_g\mu_g}{\sigma_g}\tag{4}$$
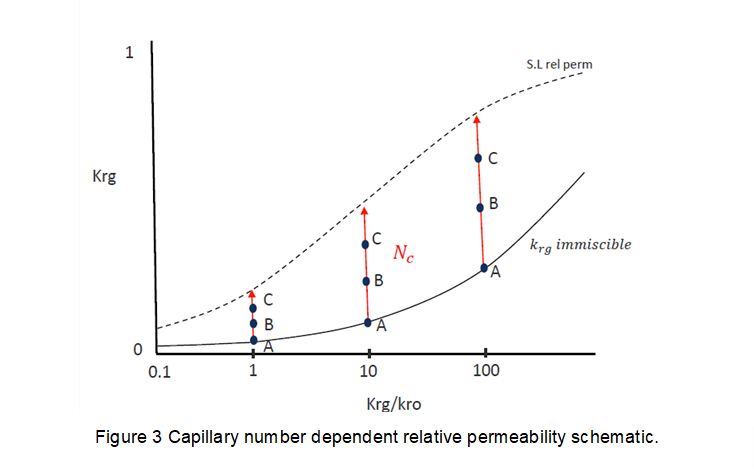
was used to correlate the krg improvement, with low Nc values giving conventional (sometimes referred to as “immiscible”) steady-state relative permeability behavior for laboratory flow velocities. At sufficiently high Nc values, krg increases from the immiscible value krgI towards a maximum improvement given by the straight-line relation krgM=Sg, or krgM=[1+(krg/kro)-1]-1.
Figure 3 shows the concept of capillary number improvement on gas relative permeability going away from the immiscible curve (A) towards the straight line (C). Nc is mainly controlled by flow rate and well geometry, with interfacial tension and viscosity variations playing a minor role in Region 1.
If lab steady-state gas-oil relative permeabilities are unknown, we recommend using two sensitivities with (a) Corey-type function where krg=0.05 at krg/kro=1, representing a “poor” rock quality and severe blockage effect, and (b) straight-line curves representing minimum blockage effect for high Nc values. If either relative permeability model leads to significant impact on well deliverability (e.g. duration of plateau period), then cores should be collected and appropriate laboratory tests conducted using steady state flow tests with realistic synthetic fluids at reservoir conditions[2],[3],[4].
What impact can condensate blockage have on well deliverability?
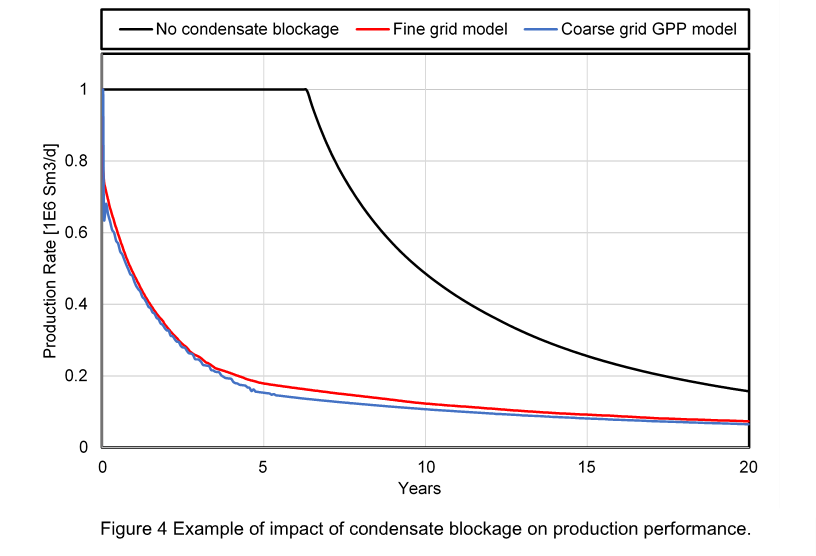
A field example is shown in Figure 4 where the black line represents the production of a gas condensate well modeled with coarse grid and without any treatment of condensate blockage. The red line is a finely-gridded, single-well radial model equivalent to the model generating the black line. Clearly, condensate blockage significantly reduces the well deliverability, going from an incorrect plateau period of approximately 7 years to immediate rate decline. The other key takeaway is that utilizing the three-region method in a coarse-grid model (“Coarse grid GPP model”) captures condensate blockage with similar accuracy to a finely-gridded single-well model.
The Schlumberger ECLIPSE E100 and E300 simulators both have valid implementation of the Fevang-Whitson gas pseudopressure method (“GPP”), as do a few other commercial and in-house IOC company simulators (without our having tested the implementations). The black-oil E100 GPP treatment does not include capillary number dependence, while the EOS E300 GPP treatment does include capillary number dependence of relative permeability. Furthermore, E300 has cell-to-cell modeling capability using Nc-dependent relative permeabilities; this feature can be used to verify the accuracy of the GPP coarse-gridded model versus an equivalent finely-gridded treatment of condensate blockage that includes Nc dependence.
References
- Fevang, Ø., and Whitson, C.H.: “Modeling Gas-Condensate Well Deliverability”, SPE paper 30714 prepeared for presentation at the 1995 Annual Technical Conference & Exhibition (Oct. 22-25), Dallas.
- Whitson, C.H., Fevang, Ø., and Saevareid, A.: “Gas Condensate Relative Permeability for Well Calculations”, Transport in Porous Media, 52, 279-311 (2003).
- Whitson, C.H., Fevang, Ø., and Saevareid, A.: “Gas Condensate Relative Permeability for Well Calculations”, SPE paper 56476 presented at the 1999 Annual Technical Conference & Exhibition (Oct. 3-6), Houston.
- Whitson, C.H., Fevang, Ø., and Saevareid, A.: “An Engineering Approach To Measuring And Modeling Gas Condensate Relative Permeabilities”, paper presented at the 1999 Society of Core Analysts Meeting (Aug. 2-4) Goldon, CO.
Learn more about our consulting capabilities
###
Global
Curtis Hays Whitson
curtishays@whitson.com
Asia-Pacific
Kameshwar Singh
singh@whitson.com
Middle East
Ahmad Alavian
alavian@whitson.com
Americas
Mathias Lia Carlsen
carlsen@whitson.com
About whitson
whitson supports energy companies, oil services companies, investors and government organizations with expertise and expansive analysis within PVT, gas condensate reservoirs and gas-based EOR. Our coverage ranges from R&D based industry studies to detailed due diligence, transaction or court case projects. We help our clients find the best possible answers to complex questions and assist them in the successful decision-making on technical challenges. We do this through a continuous, transparent dialog with our clients – before, during and after our engagement. The company was founded by Dr. Curtis Hays Whitson in 1988 and is a Norwegian corporation located in Trondheim, Norway, with local presence in USA, Middle East, India and Indonesia