Author: Stian Mydland
*This is a short-version of URTEC-2020-2765-MS presented at Unconventional Resources Technology Conference (URTeC) 2020. Paper can be downloaded in the end of this article.
Reservoir simulation requires a fluid model to describe the volumetric behavior of gas and oil. When initiating a reservoir simulation study, we have to choose whether to use a black-oil PVT model, or an EOS-based compositional model. In most reservoir simulation studies, we choose a black-oil PVT model because the simulation runtime can be 1-3 orders of magnitude less compared to using a compositional model.
For pressure-depletion type simulations, it is most often sufficient to use a black-oil PVT (BOPVT) model. However, for simulation of gas-based EOR processes, we can no longer “assume” that the BOPVT model is sufficient. Using a BOPVT model for such simulation cases should be validated by comparing the predicted results to those of a simulation using an EOS-based compositional fluid model.
We show through several examples for a wide range of fluid systems that a black-oil PVT model is insufficient to properly model the gas-based Huff-n-Puff (HnP) process. This is done by comparing the predicted recovery performance when using a black-oil model, to that of using a compositional model, where we assume the “correct” performance is predicted by the latter.
Fluid Model Considerations
We emphasize the need for the two fluid models to be consistent to have an “apple-to-apple” comparison of the simulation results. We argue that this is achieved by generating the black-oil PVT tables using the same EOS as is used for the compositional model. We also discuss the need for extrapolating the black-oil PVT table to a critical mixture when modeling gas-based EOR. Fig. 1 shows an example of the solution GOR versus saturation pressure for one of the fluid systems (black-oil) studied in the paper. The solid red and green lines represent the part of the black-oil PVT table coming from the “traditional” way of creating a black-oil PVT table (i.e. depleting the initial reservoir composition using some depletion experiment, e.g. a CCE test). The dashed lines represent the extrapolated part of the table, in which the initial reservoir fluid has been swelled to a critical mixture. The swelling of the initial reservoir fluid “closes” the GOR gap (500 to ~36350 scf/STB) that is missing in the lower part of the black-oil table. This will remove any numerical issues of modeling a gas-injection process for which a large range of GORs are expected in the model.
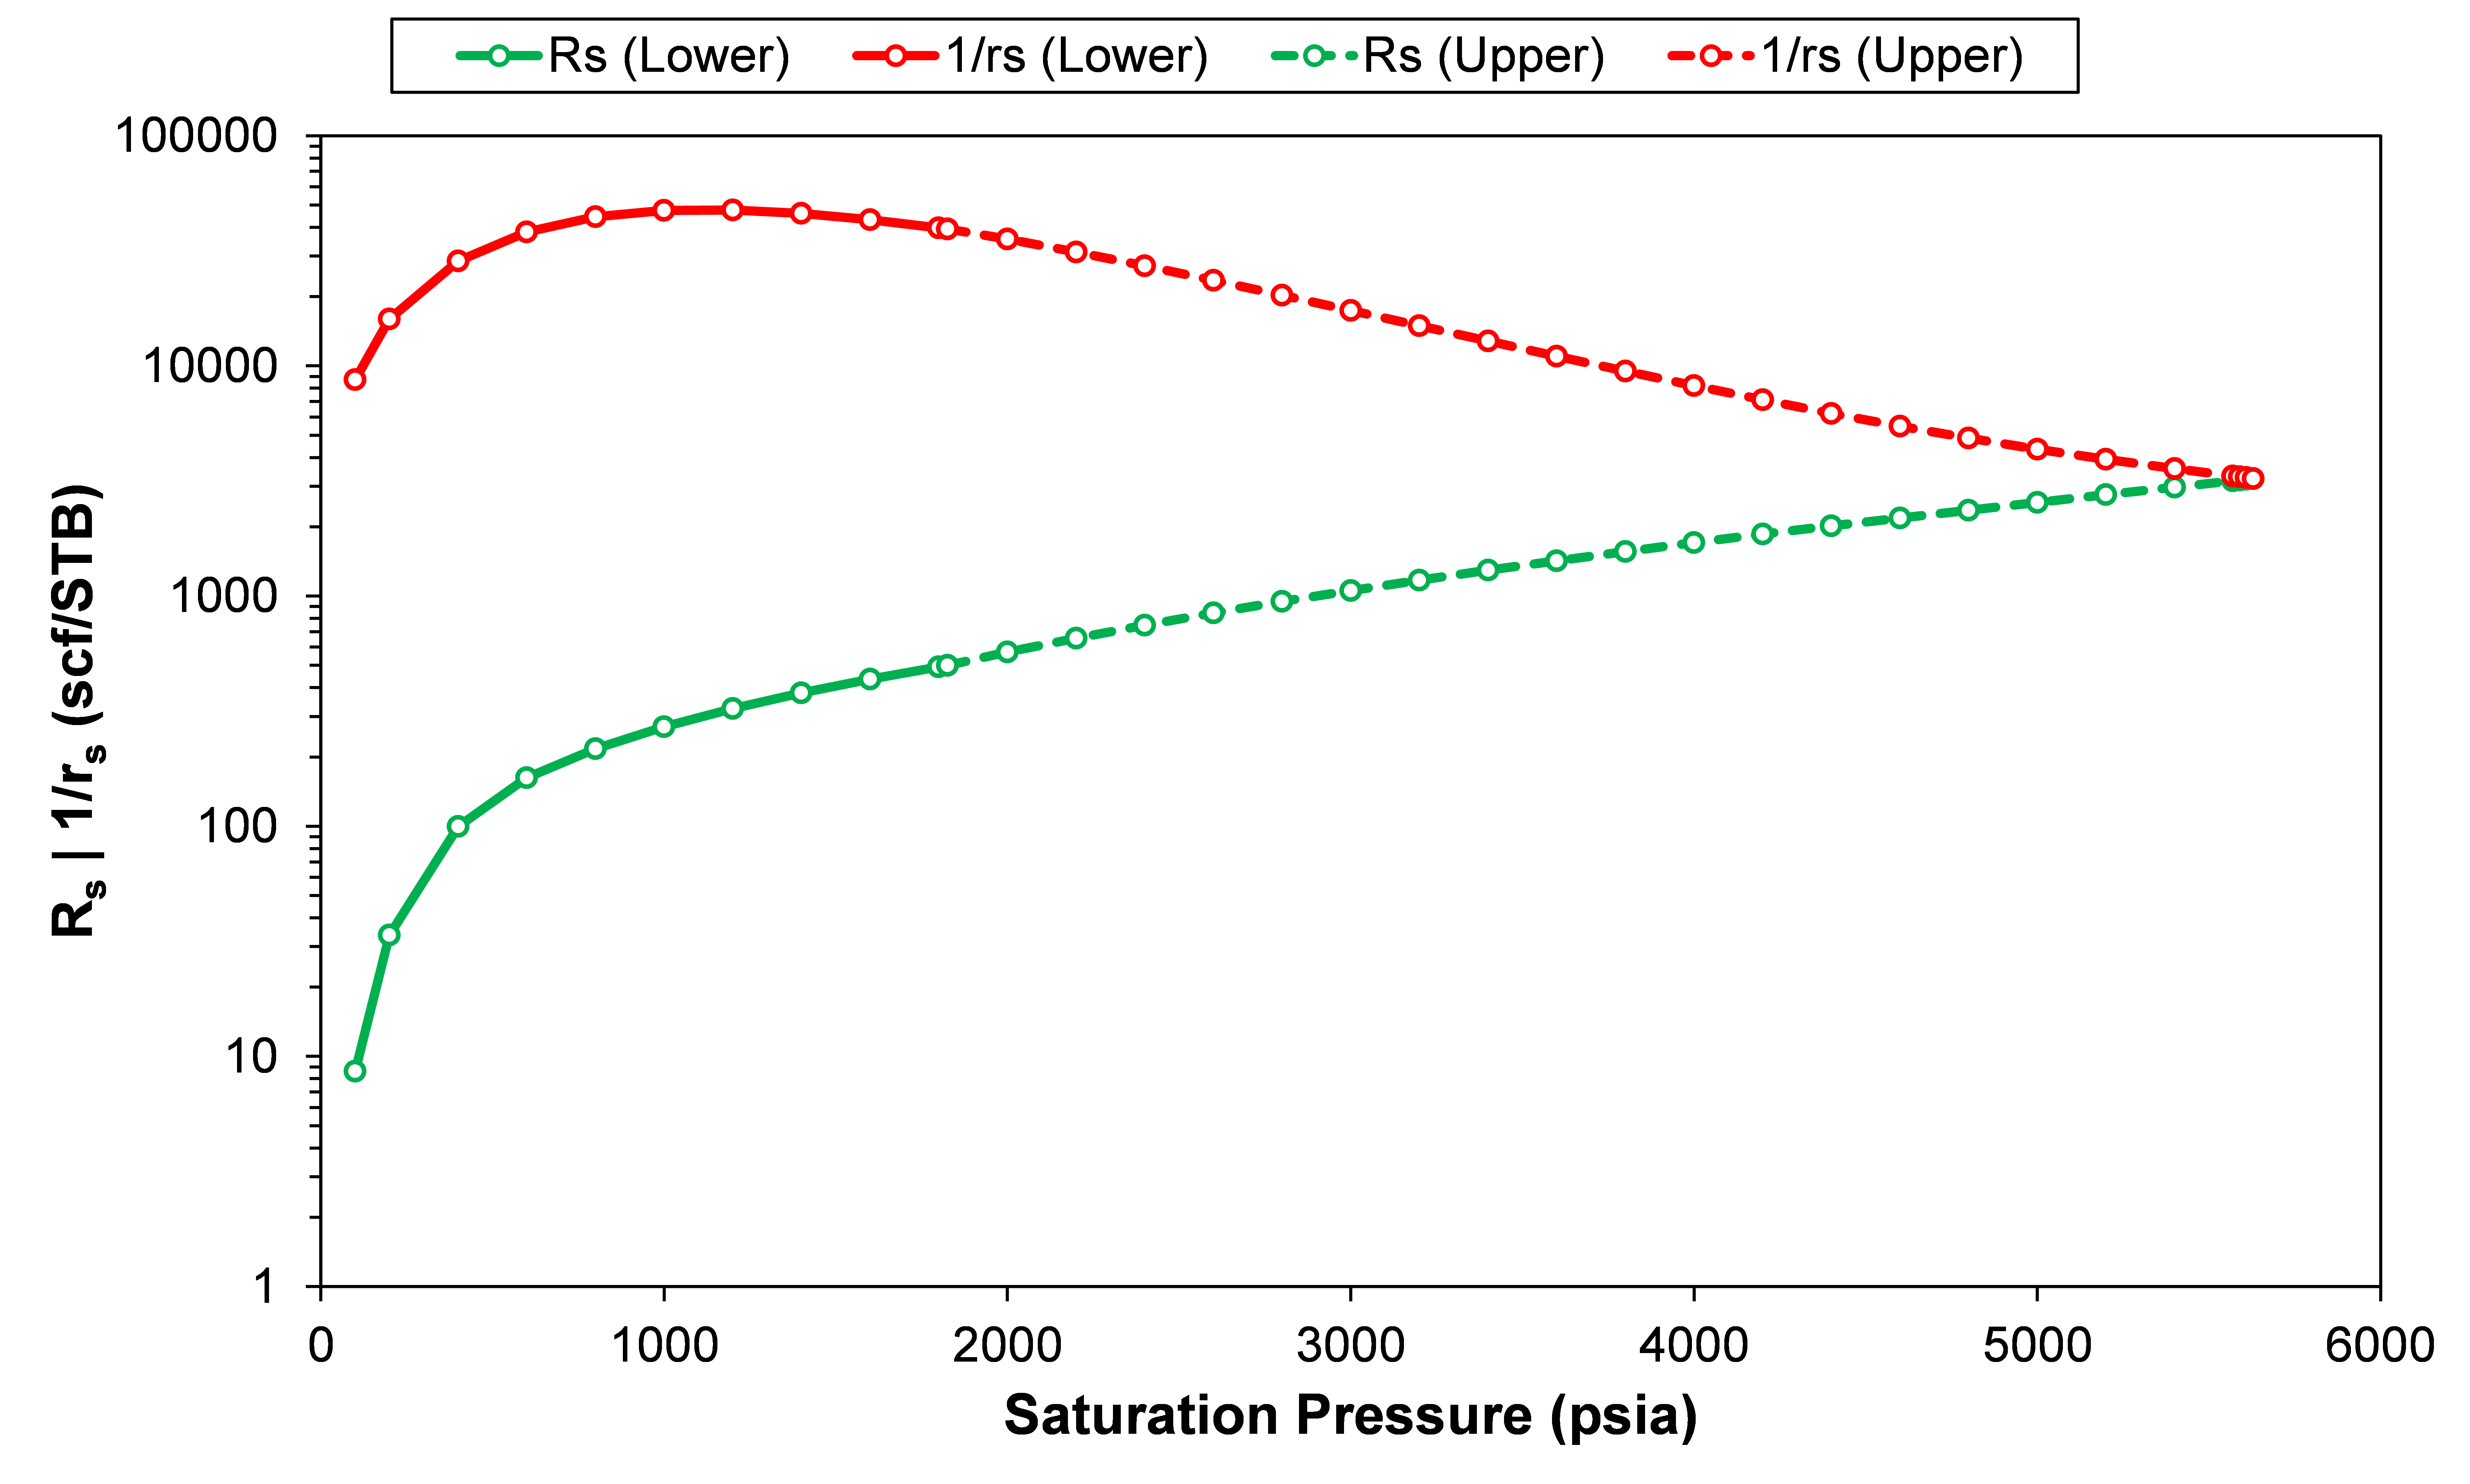 |
| Fig. 1—Solution gas/oil ratio and inverse solution oil/gas ratio versus saturation pressure for the BO fluid system |
Huff-n-Puff—Black-Oil and Compositional
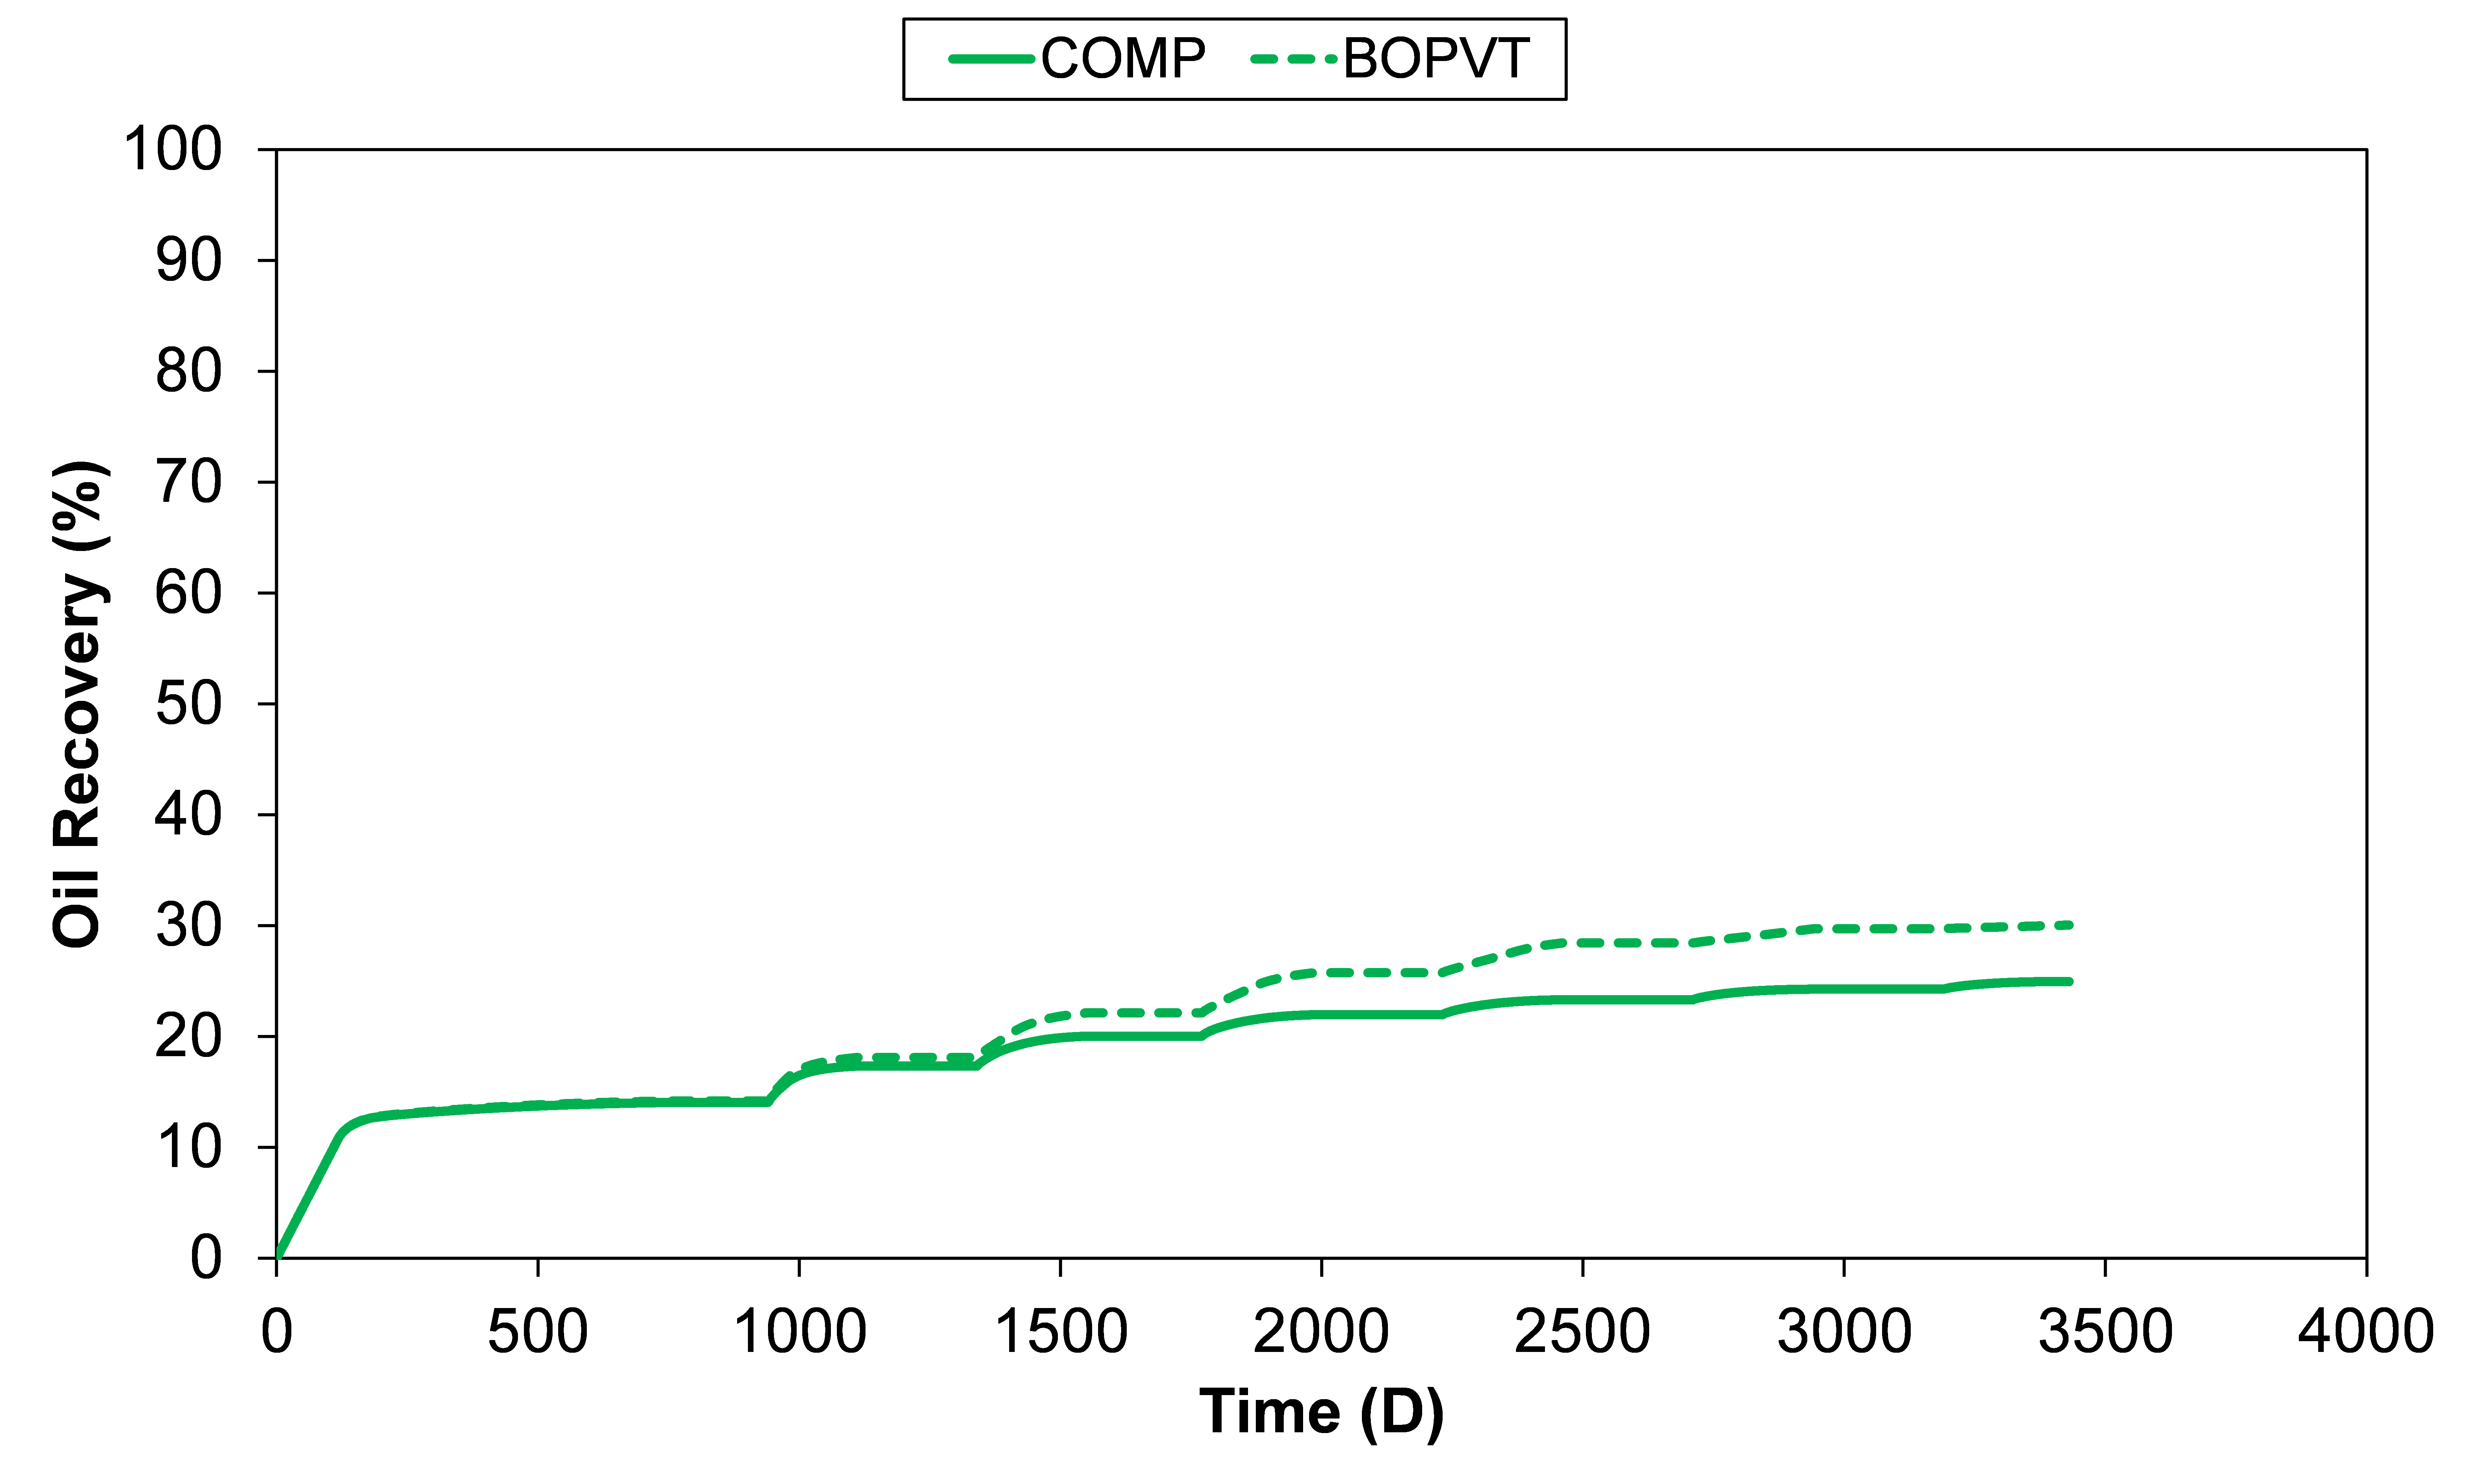
The Huff-n-Puff (HnP) process was modeled using five different fluid systems ranging from black oil to gas condensate. The reservoir model consists of a hydraulic fracture, with a surrounding shattered volume represented by a dual-porosity formulation. We believe the shattered volume to be the contributing region to recovery by the HnP process. Therefore, we study in detail the production behavior for a single dual-porosity grid block, in addition to the full reservoir model. Fig. 2 shows the resulting recovery profile from the case of an initially undersaturated volatile oil (Rsi = 2000 scf/STB) for the black-oil and compositional fluid models. We see that the black-oil model overpredicts the recovery, a result we saw consistently in all cases.
 |  |
From the study on a single dual-porosity block, we found that there are two main reasons for why the black-oil PVT model overpredicts the oil recovery for the HnP process:
1) Underprediction of the saturation pressure of the reservoir-fluid/injection-gas mixture.
2) Overprediction of the injection gas’ ability to vaporize and retain the oil in solution.
Fig. 3 shows the predicted saturation pressure (ps) in the matrix grid block for the black-oil (blue) and compositional (pink) fluid models. The plot also shows the pore pressure (p) (gray line) in the matrix grid block to illustrate when the fluid mixture is single-phase (p>ps) and two-phase (p<ps). The saturation pressure predicted by the compositional model increases with HnP cycles, reflecting that the oil in place is being stripped of its intermediate hydrocarbon components, and thus harder to vaporize with each cycle. The opposite trend is predicted by the black-oil model, where we see the saturation pressure decreases with HnP cycles. The recovery of oil by the HnP process is most efficient when the producing mixture is single-phase (i.e. oil swelling/gas cycling) for the entire production period, and least efficient when the producing mixture is two-phase (i.e. vaporization) for the production period. Hence, a decrease in saturation pressure will make the HnP process more efficient with an increasing number of HnP cycles, which is the opposite of what physically happens.
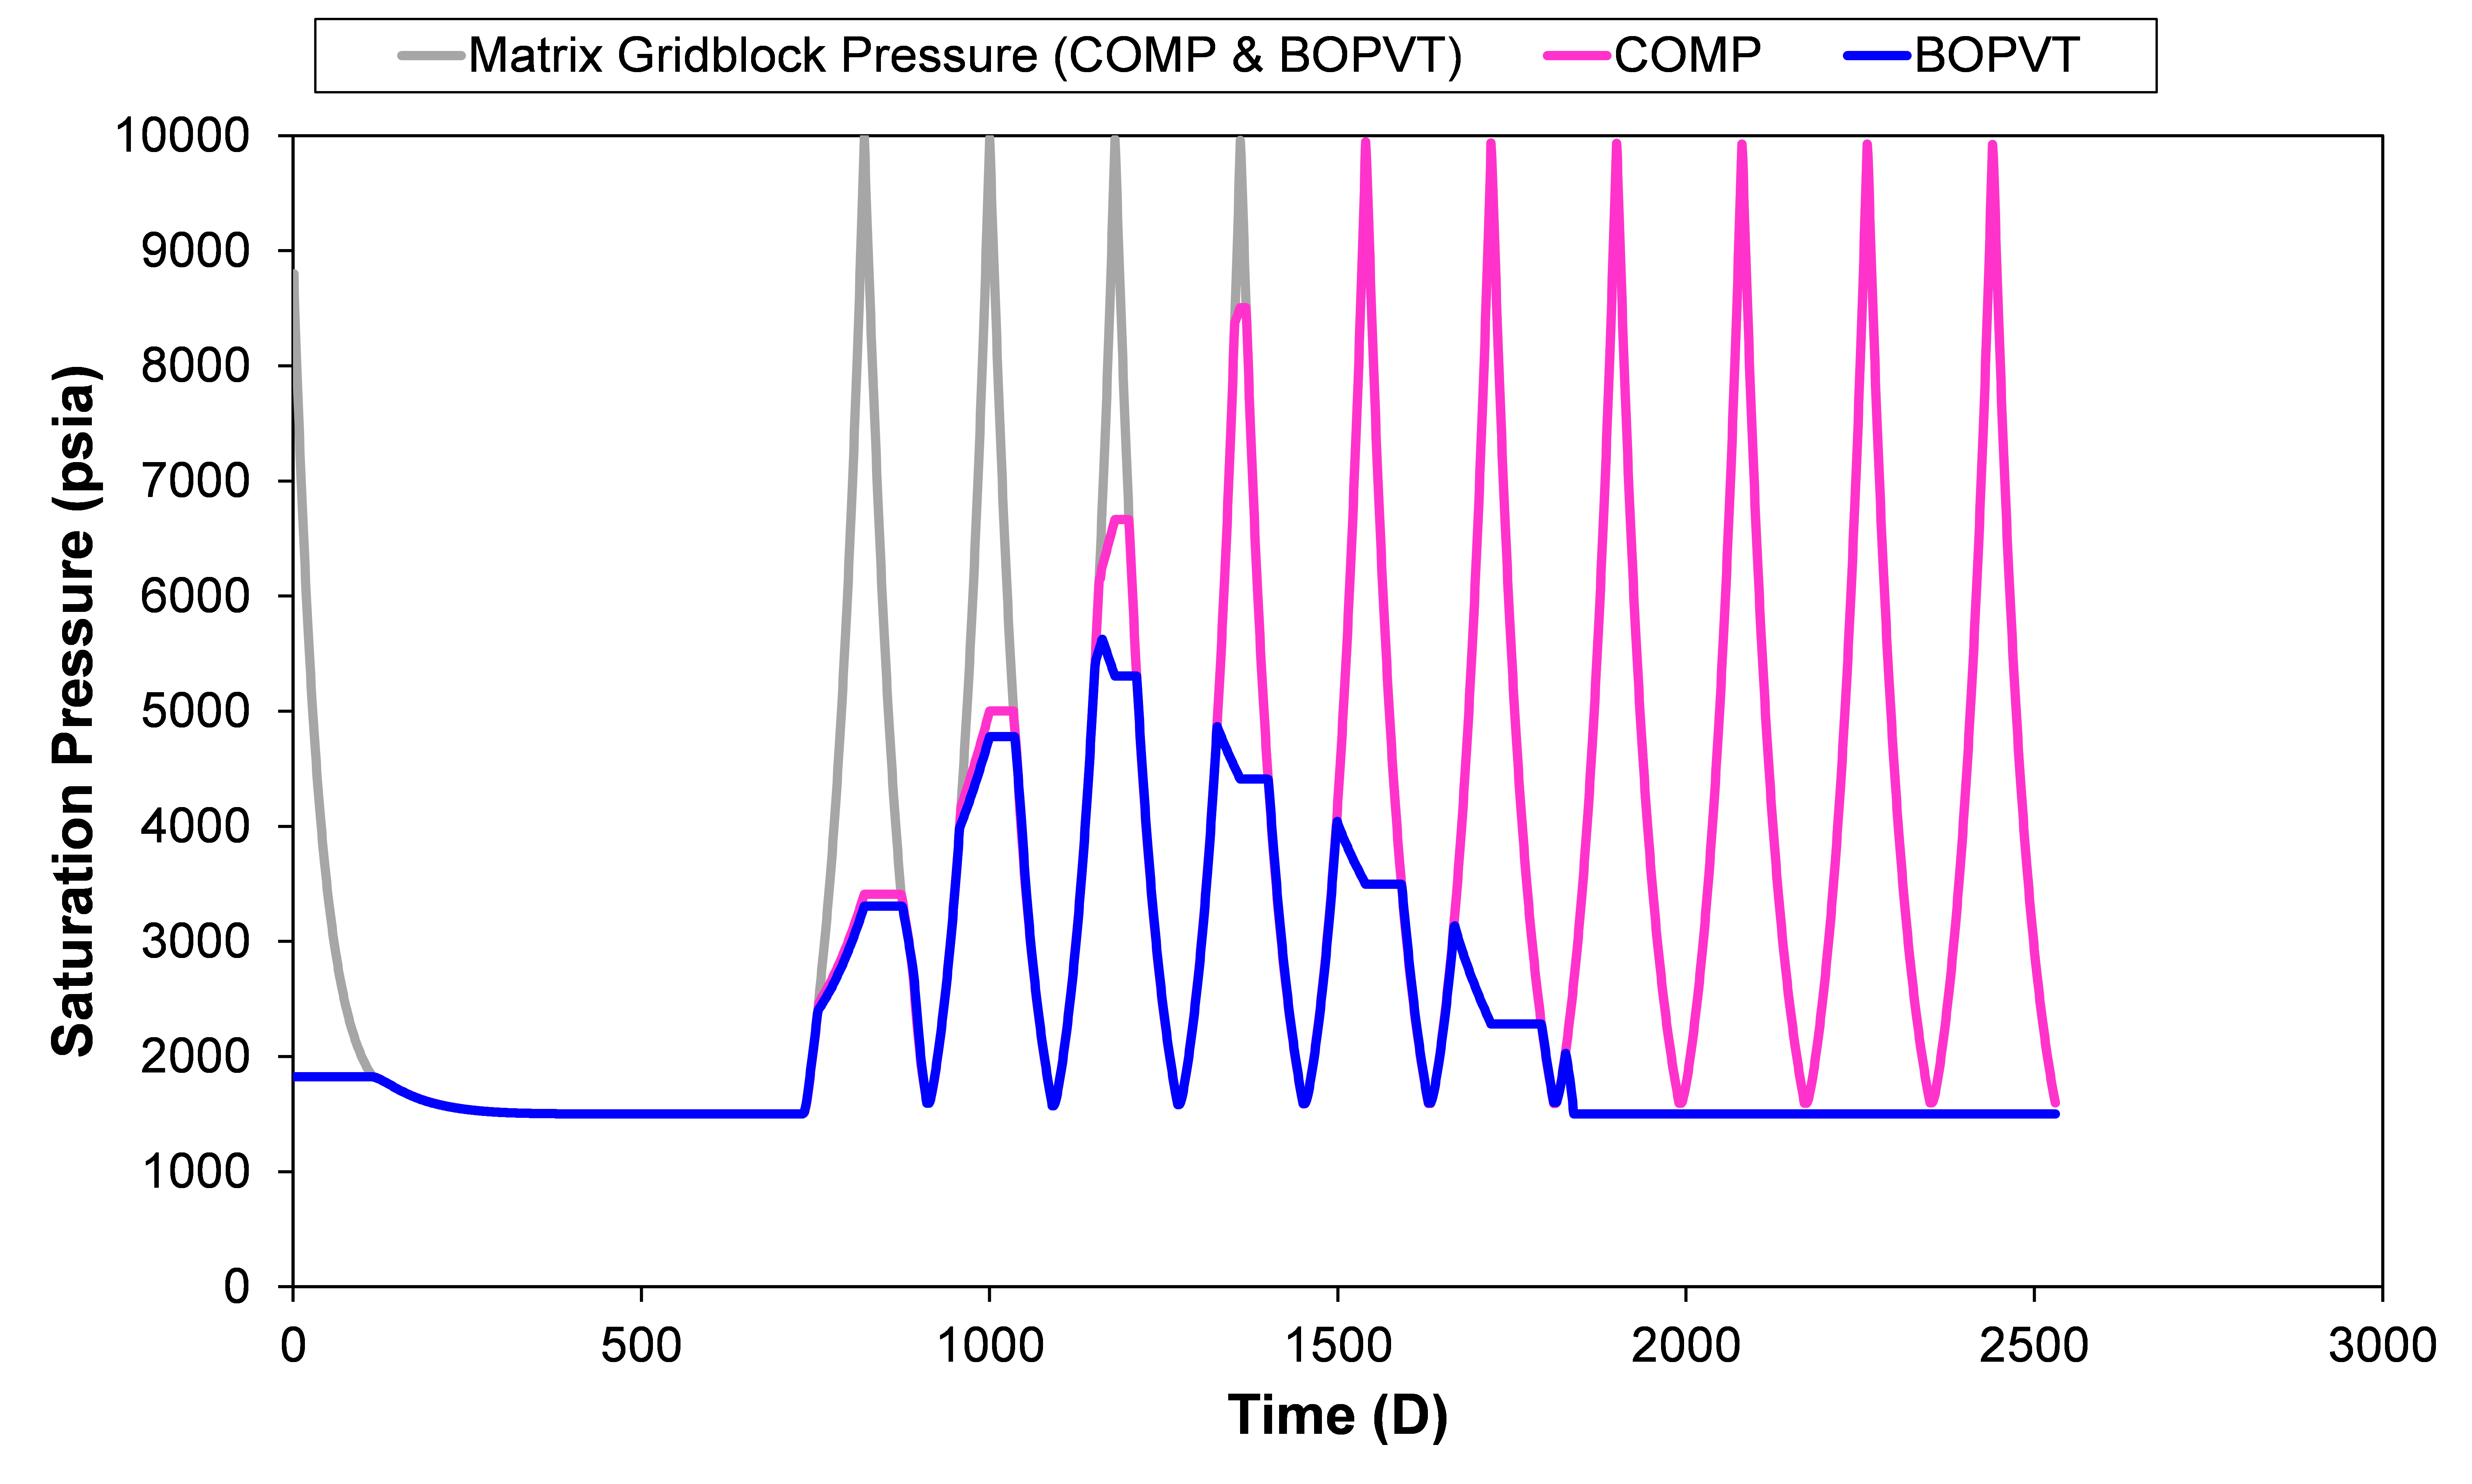 |
| Fig. 3—Saturation pressure in the dual-porosity matrix grid block |
Fig. 4 shows the solution GOR and inverse solution OGR as a function of saturation pressure. The thick red and green lines represent the black-oil table data. In every HnP cycle, the injection gas’ ability to carry oil in solution will be described by the thick red line when using the black oil model. The thin red and green lines are the “true” phase behavior of the fluid mixture (when two-phase) in the matrix grid block. We see that the solution OGR is decreasing with increasing HnP cycles, meaning the injection gas vaporizes less condensate every cycle.
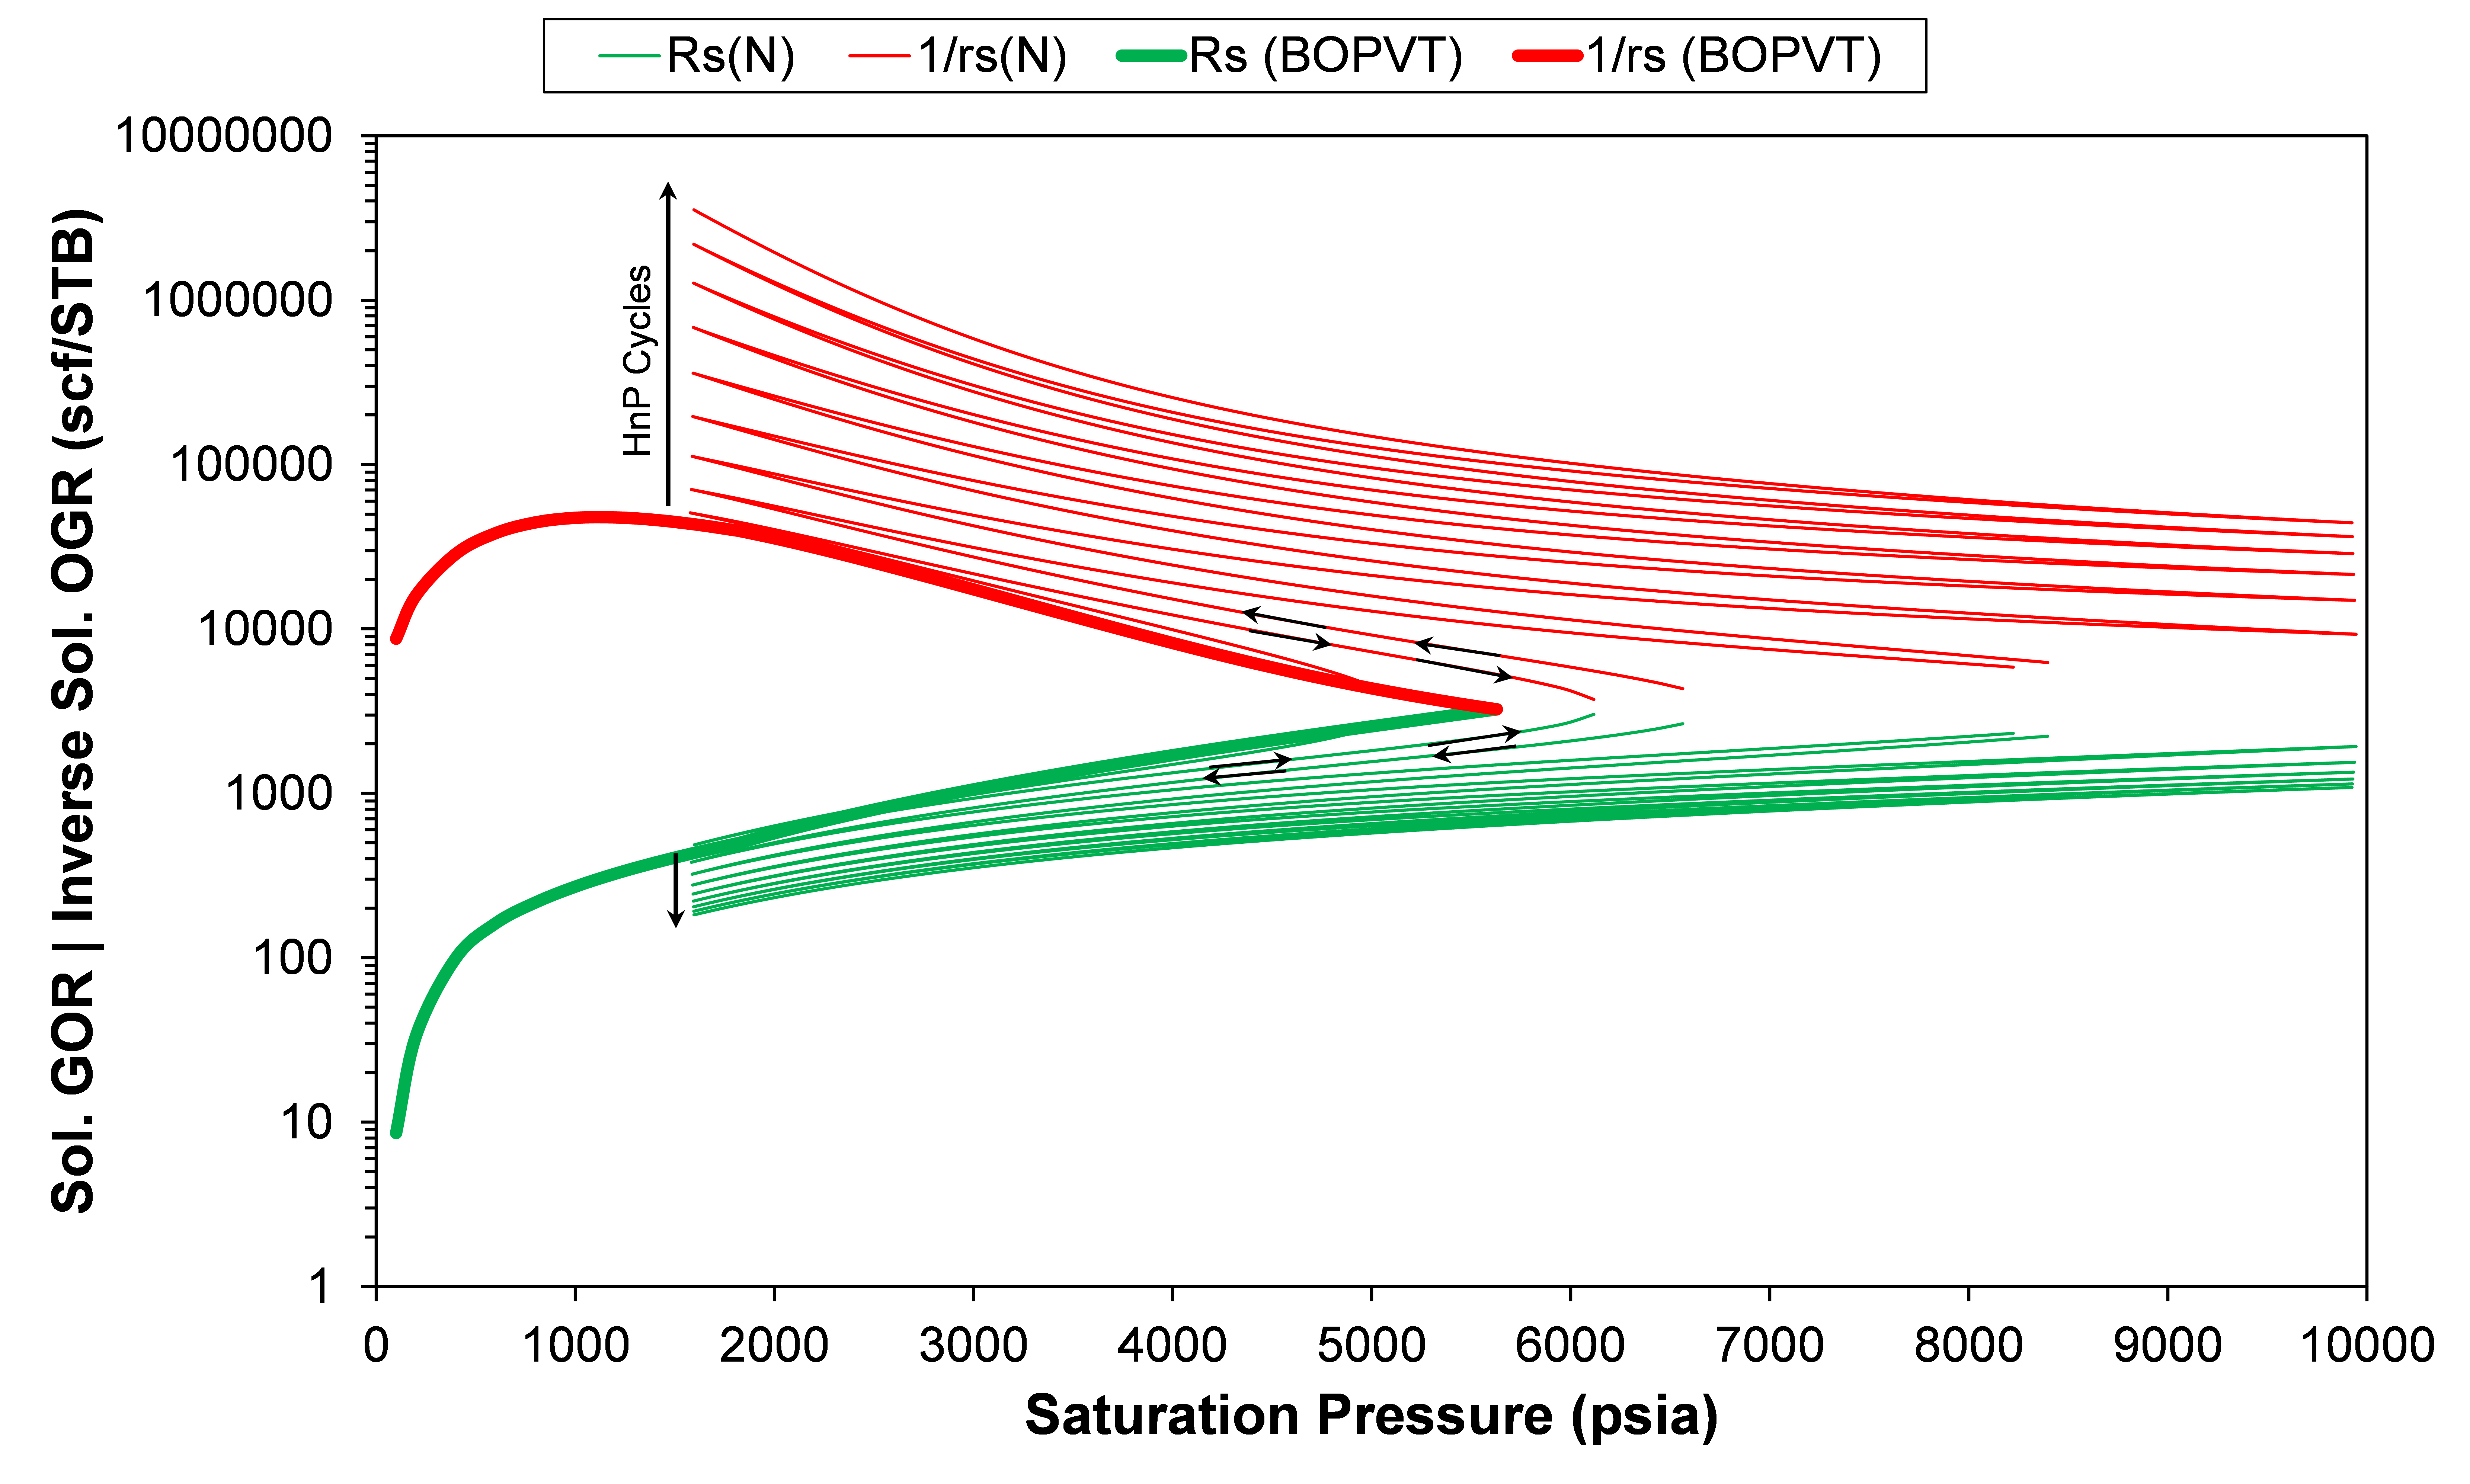 |
| Fig. 4—Solution gas/oil ratio and inverse solution oil/gas ratio for BO fluid system. The thick lines indicate the black-oil PVT properties used in the black-oil PVT model, whereas the thin lines represent the “true” variation with HnP cycle (lines obtained from processing the cell compositions from an equivalent compositional run). |
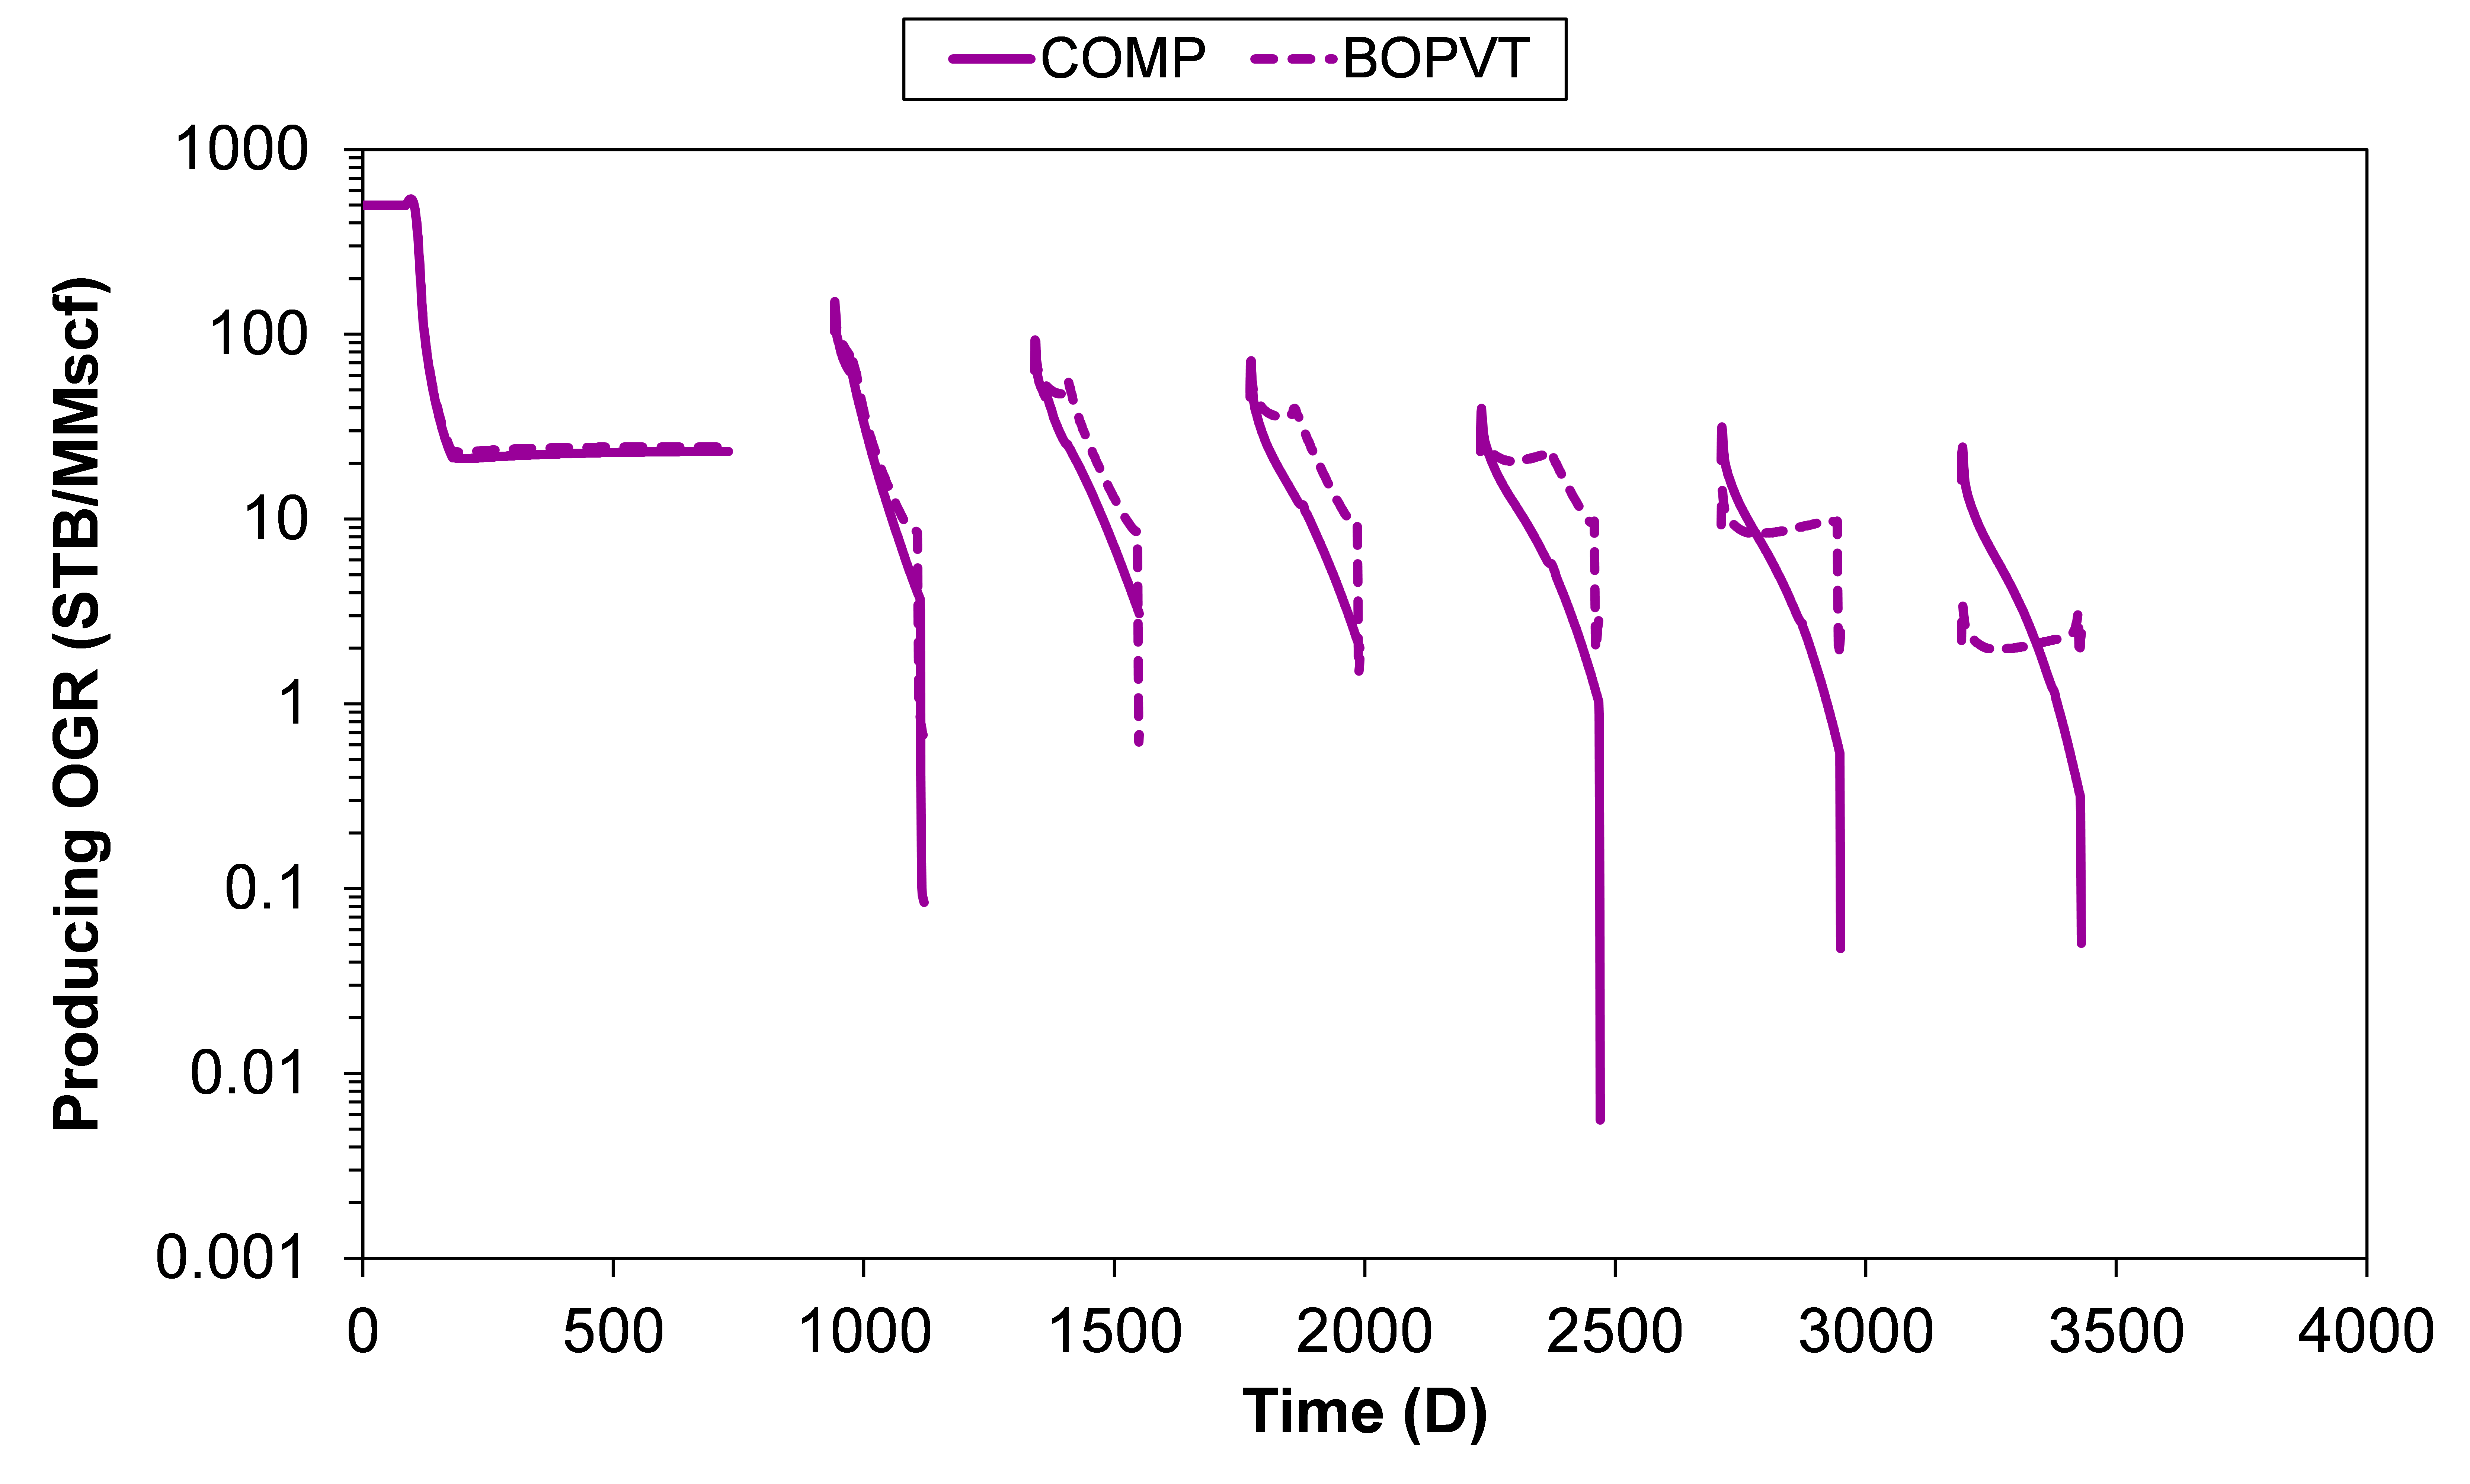
The consequence of underpredicting the saturation pressure and overpredicting the solution OGR, can be seen in the producing OGR plot shown in Fig. 5. For a constant producing gas rate, this plot is equivalent to the condensate-rate profile. The underprediction of the saturation pressure results in a prolonged plateau production of condensate, and the overprediction of the solution OGR results in a less decline in OGR and a generally higher OGR over time during production (i.e. when pressure is decreasing).
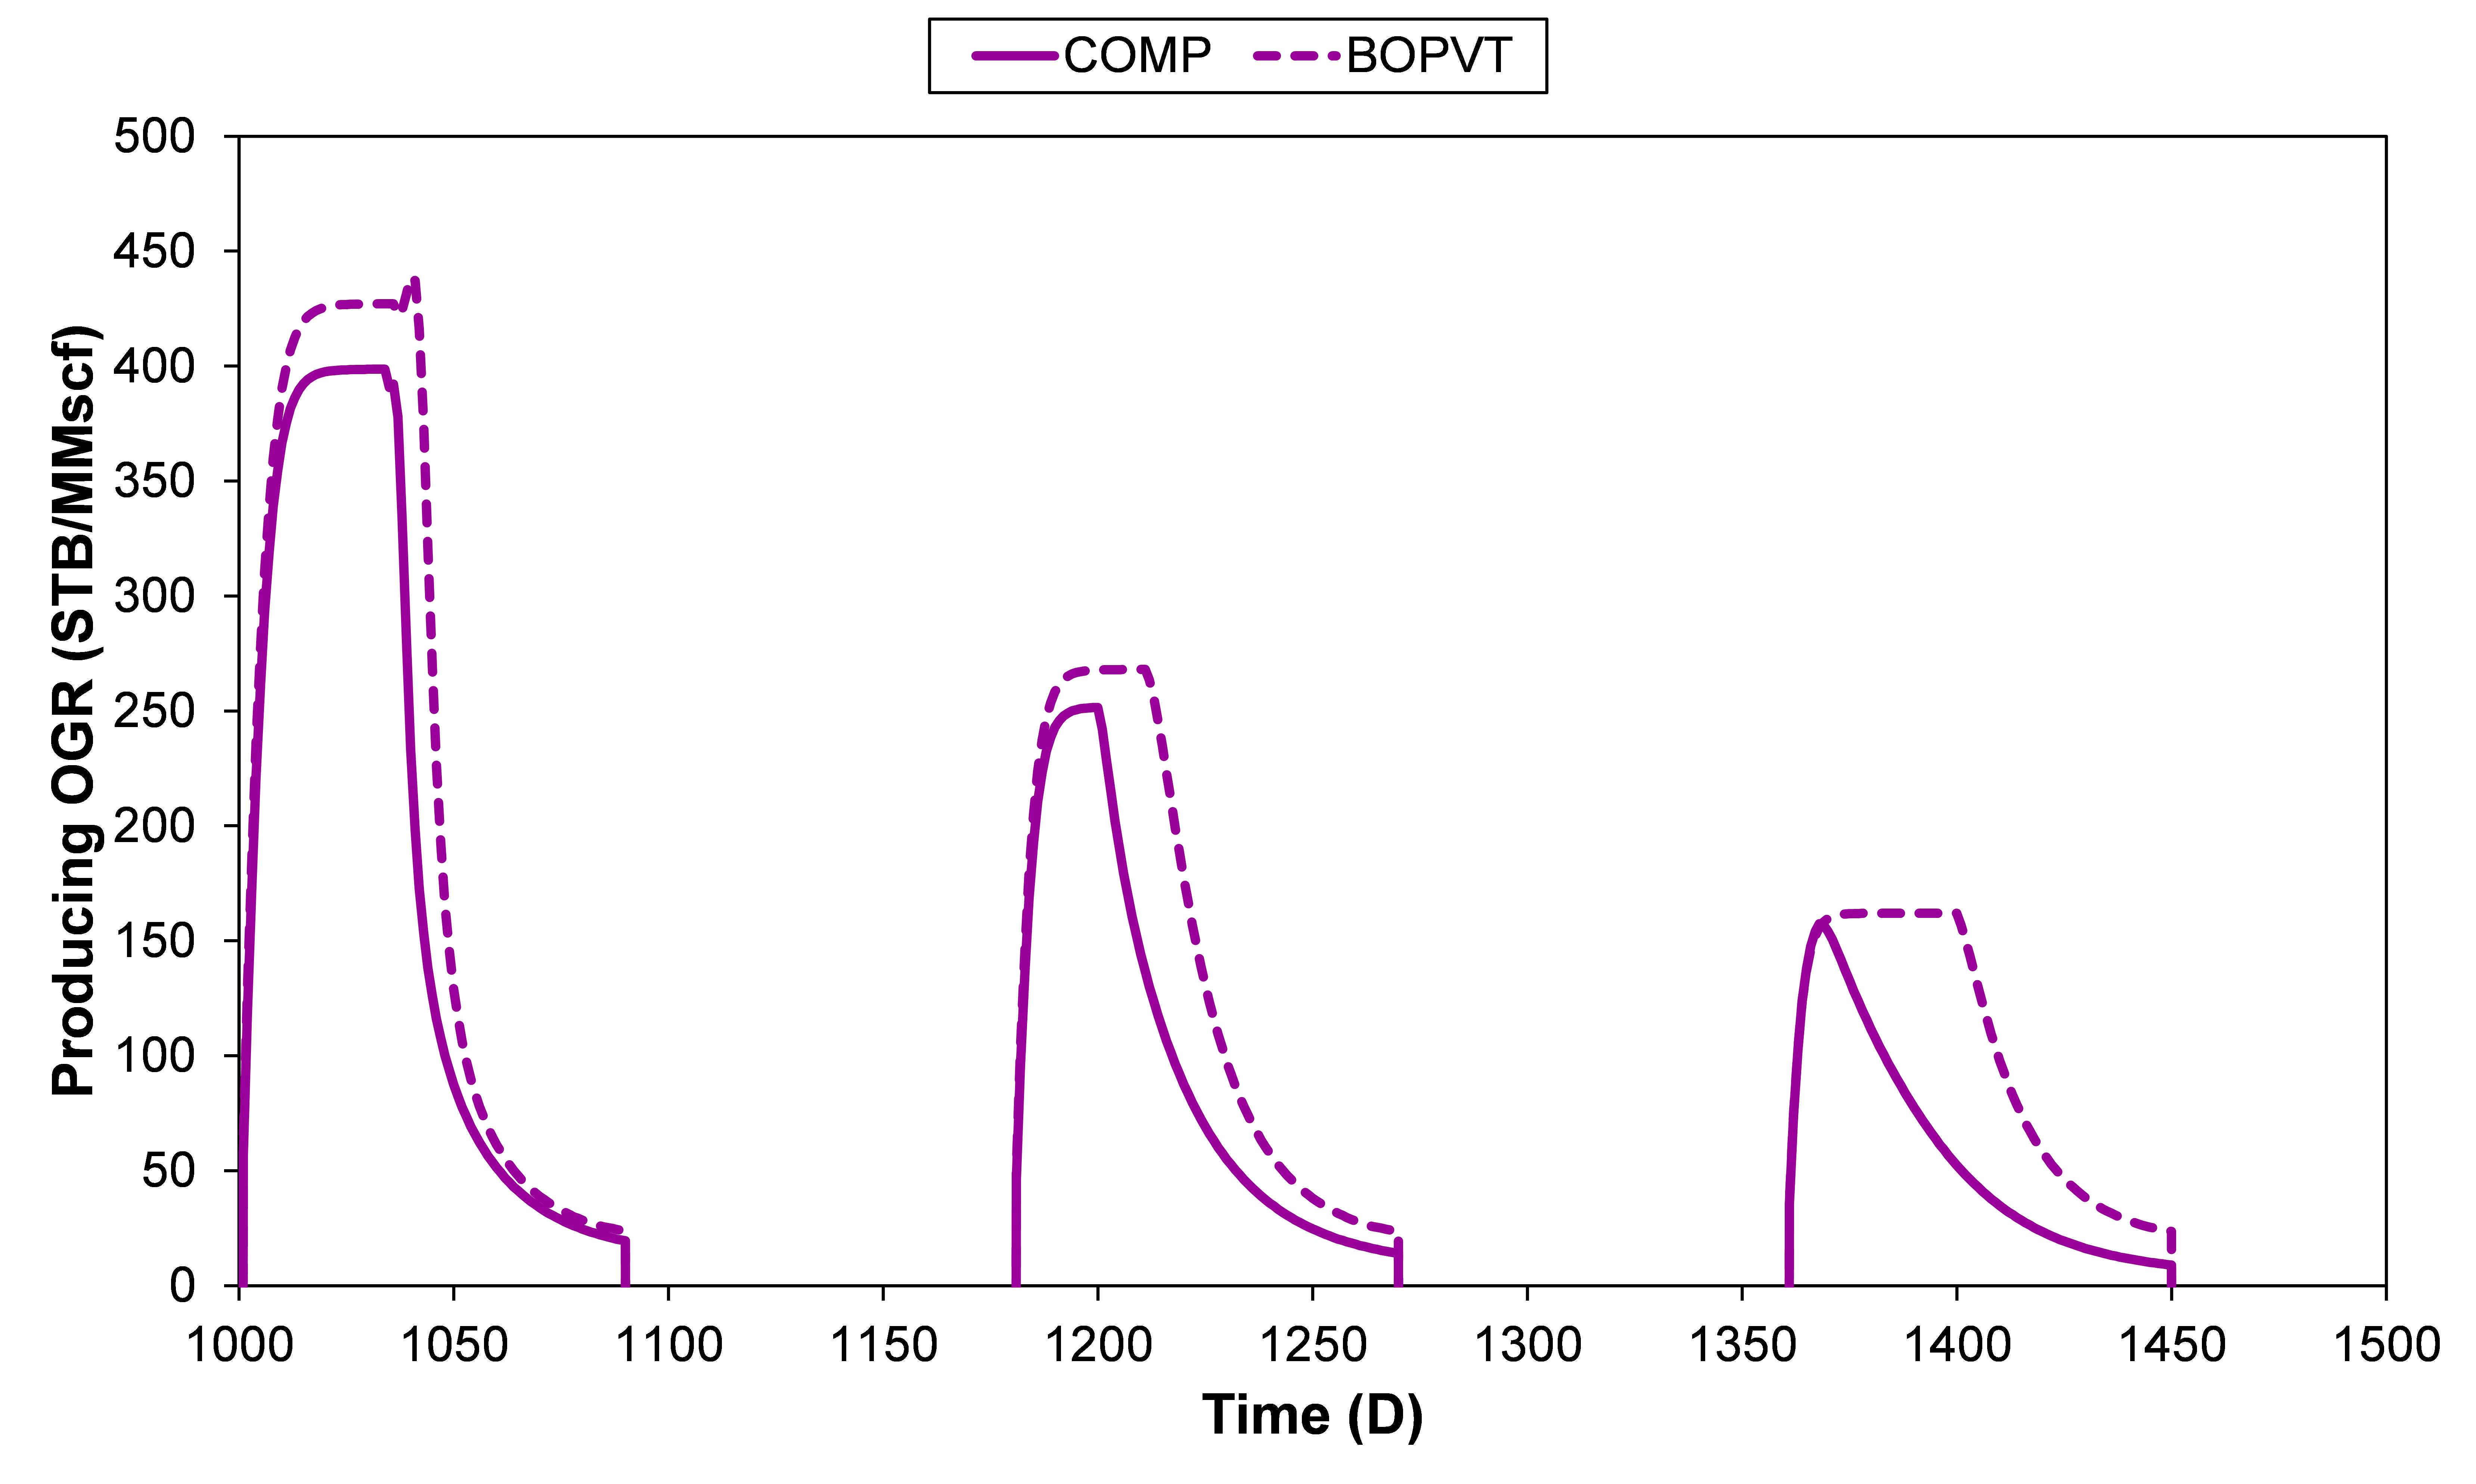 |
| Fig. 5—Producing oil/gas ratio for huff-n-puff cycles 2 through 4 in Fig. 3. |
Summary
- Gas-based enhanced oil recovery in tight unconventionals requires a compositional fluid treatment in reservoir simulation to properly capture the key phase behavior controlling EOR recovery.
- The black-oil PVT model will in all cases overpredict the oil recovery for the huff-n-puff method. This is because a single black-oil PVT table does not capture properly the change in matrix pore volume composition over time, i.e. that the oil in the reservoir becomes heavier, and thus harder to vaporize, with each huff-n-puff cycle.
- Extrapolating the black-oil PVT table to the critical point using the injection-gas composition will remove instabilities in the simulation, but the predicted oil recovery for most of the cases involving the HnP process will overestimate the “true” recovery.
Learn more about our consulting capabilities
###
Global
Curtis Hays Whitson
curtishays@whitson.com
Asia-Pacific
Kameshwar Singh
singh@whitson.com
Middle East
Ahmad Alavian
alavian@whitson.com
Americas
Mathias Lia Carlsen
carlsen@whitson.com
About whitson
whitson supports energy companies, oil services companies, investors and government organizations with expertise and expansive analysis within PVT, gas condensate reservoirs and gas-based EOR. Our coverage ranges from R&D based industry studies to detailed due diligence, transaction or court case projects. We help our clients find the best possible answers to complex questions and assist them in the successful decision-making on technical challenges. We do this through a continuous, transparent dialog with our clients – before, during and after our engagement. The company was founded by Dr. Curtis Hays Whitson in 1988 and is a Norwegian corporation located in Trondheim, Norway, with local presence in USA, Middle East, India and Indonesia