Authors: Ahmad Alavian & Curtis Hays Whitson
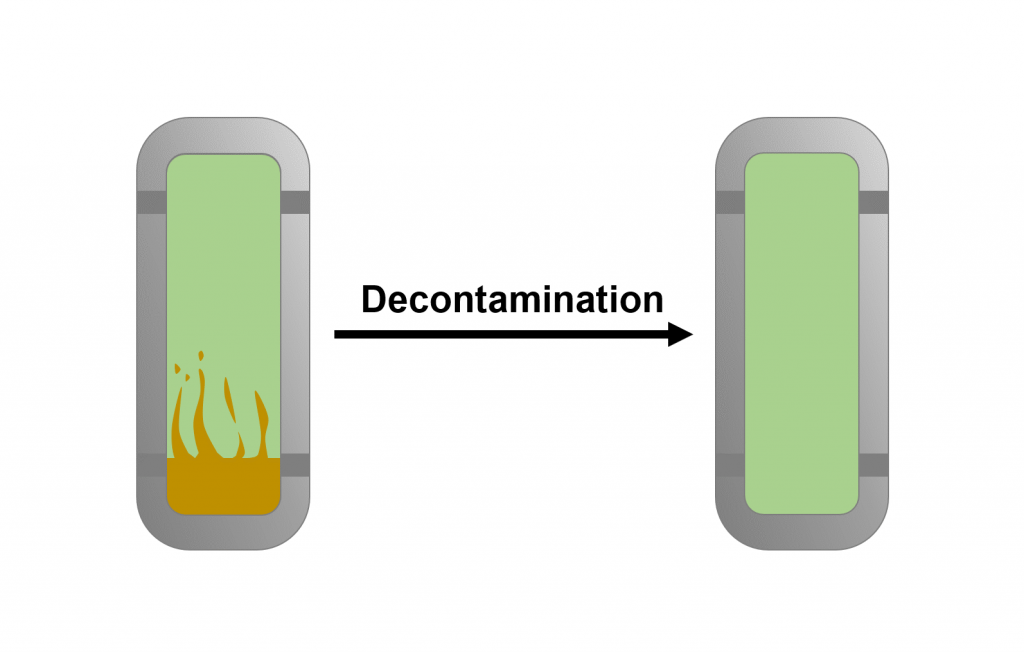
A contaminated sample is collected in an openhole formation testing tool (OFT) like MDT or RCI. The well has been drilled with oil based mud (OBM), where some percentage of the collected sample being OBM and the remainder being in-situ reservoir fluid. Finding a good estimate of the reservoir fluid composition by mathematical decontamination is often straight-forward and quite accurate. Mathematically de-contaminated sample compositions provide the best data for mapping spatial variation of fluids in a reservoir (“fluid initialization”).
Contaminated samples are not usually recommended for obtaining measured PVT data that will be used to develop an EOS model. Instead, production samples (bottomhole or separator recombined) having no OBM contamination are best suited for obtaining measured PVT data that will be used in EOS model development.
Sometimes a new field/reservoir has only OBM-contaminated samples. In such cases, PVT measurements on contaminated samples are required to build a reliable and robust EOS model – with inherent uncertainty in an EOS model based on such samples. As a rule, the best contaminated samples for PVT measurements to be used in EOS model development are those with lowest level of OBM contamination.
OFT reservoir samples are taken to a PVT lab. We always recommend measuring composition of all OFT samples by flash-GC-recombination methods. This is necessary to quantify the degree of OBM contamination; it also serves as the basis for selecting samples that may be used for PVT studies (when only contaminated samples are available), and also provides a means for estimating accurate in-situ fluid compositions. The lab starts by flashing the OFT sample to atmospheric pressure and near-ambient temperature (60-140oF). The resulting flashed oil (FLO) and flashed gas (FLG) samples are analyzed by gas chromatography (GC). The FLO molecular weight and density are also measured. The FLO and FLG are mathematically recombined to obtain the composition of the OFT reservoir fluid sample (zRi). The flashed oil sample composition will be affected by the oil base mud components – i.e., OBM molar distribution and total degree of OBM contamination. Negligible OBM components are found in the flashed gas sample.
The laboratory should also provide (or be provided) at least one compositional analysis of the OBM itself. Sources of OBM can be the original vendor, or from the mud pit where original OBM may show some “contamination” from reservoir fluids that mixed with OBM in the wellbore during drilling. Sometimes both OBM compositions are available. The OBM molecular weight and density should also be measured.
Two categories of OBM are commonly used – (1) a near-normal distribution of “paraffinic” compounds, usually in the range C14 to C22, or (2) a two-component oil such as the OBM reported by Gozalpour et al. containing C14 and C16 olefin compounds.
We initially plot the lab-measured OFT sample mass (weight-%) compositions on a normalized basis showing only C7+ compounds (C6- components are normalized “out”). On the same figure we plot the mass composition of the OBM as a “background” to readily identify the signature and and degree of contamination for each sample (see Fig. 2).
Using a graphical decontamination procedure (“subtraction” method discussed below), the PVT lab estimates OBM contamination level and estimates the decontaminated FLO composition. The mathematically decontaminated flash oil composition is then mathematically recombined with the flashed-gas sample to give an estimate of the uncontaminated reservoir fluid composition. OBM contamination level is usually reported as weight-% of the contaminated flashed oil sample, but it may also be expressed as a weight- or mole-% of the total OFT sample.
We always re-check the laboratory decontamination calculations using alternative methods that consider the entire molar distribution of C7+ components using a gamma distribution model. An Excel calculation or the EOS software PhazeComp can be used to quantify the OBM contamination level for each sample.
MacMillan, et al. [1] proposed a decontamination method using the gamma distribution model that fits measured molar (or mass) amounts of all components in the FLO that are not found in the OBM (e.g. from C7 to C13 and C23 to C36+). The tuned gamma model is then used to fill in the amounts of those components found in the OBM (e.g. C14 to C22) to give an estimate of the decontaminated FLO composition. Knowing the measured amounts of intermediate OBM-components from the FLO of the OFT sample (contaminated FLO composition), one can back-calculate the degree of contamination. This method does not require the OBM composition.
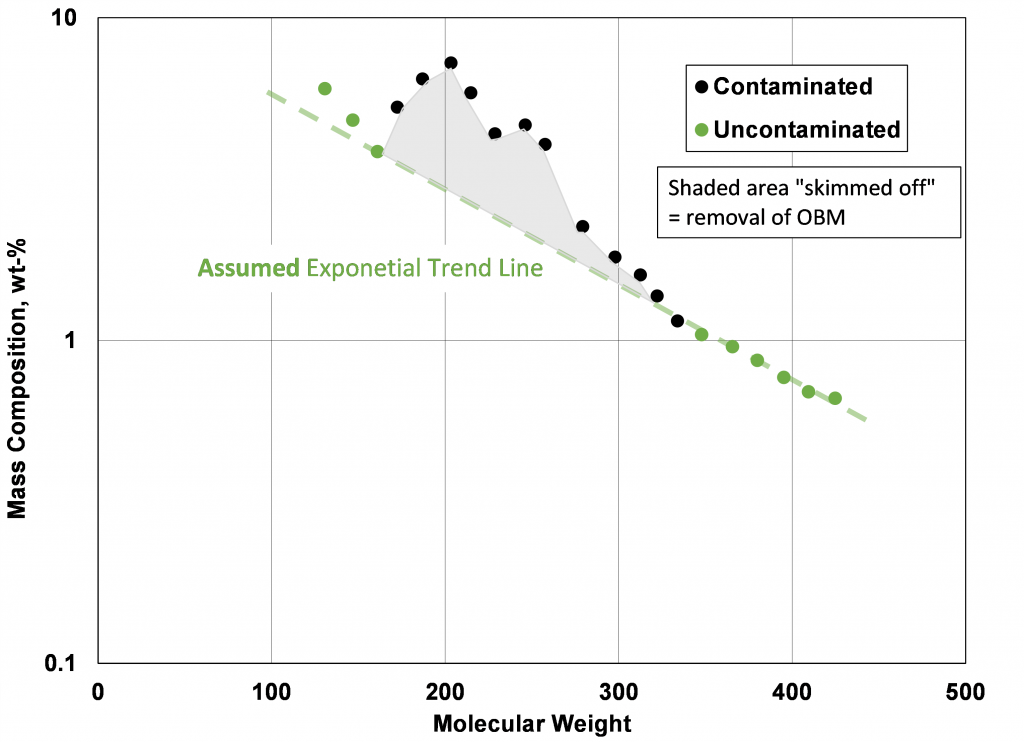
Gozalpour et. al. [2] propose two methods for decontamination of the FLO from an OFT sample: (1) “skimming” and (2) “subtraction”. The skimming method does not require the composition of the OBM, while the subtraction method does. Most laboratories use the subtraction method. Skimming assumes that the decontaminated sample has an exponential molar distribution for all plus fractions (e.g. C8+). If so, then the logarithm of mol-% plotted versus carbon number or molecular weight would result in a straight line for all components (except the very heaviest plus fraction, e.g. C36+). Gozalpour et al. assume that any contamination with OBM will result in an artificially-elevated mol-% relative to the straight-line behavior of uncontaminated reservoir fluid; this excess is simply removed (i.e. “skimmed off”) and quantified as contamination level. Skimming is illustrated in Fig. 1.
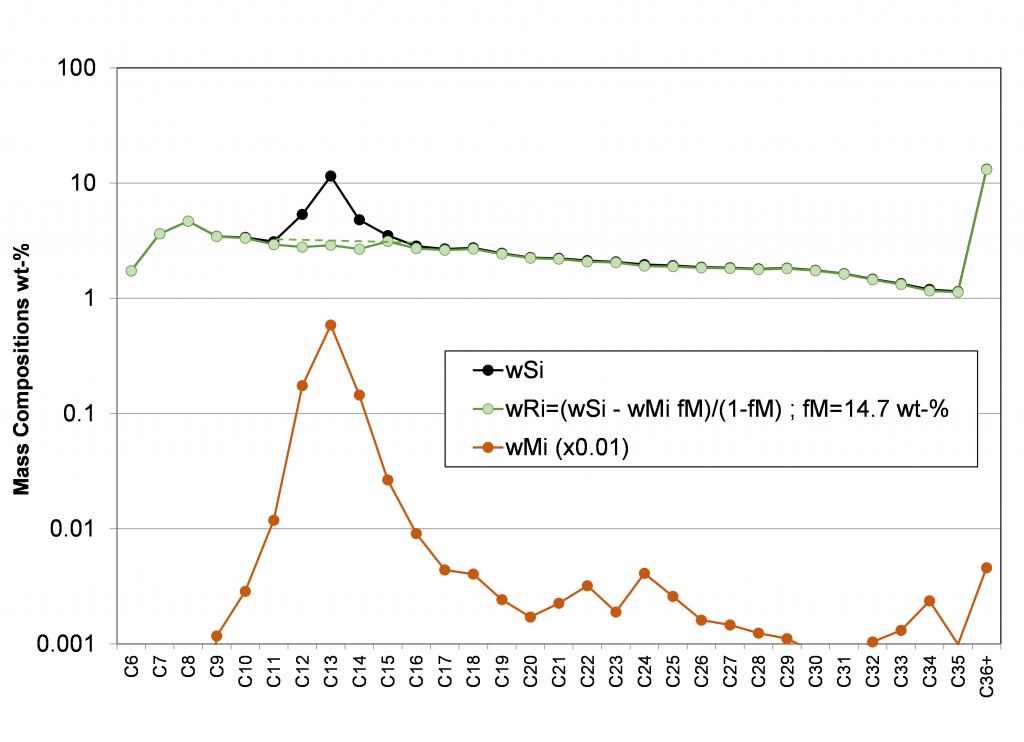
The subtraction method uses both the OFT FLO composition (wSi) and OBM composition (wMi) with the equation wSi=fMwMi+(1-fM)wRi, where wRi represents the FLO of an uncontaminated reservoir fluid sample. All compositions are in mass fractions of stabilized atmospheric oils. The method uses subtraction to obtain an estimate of wRi by assuming fM – i.e. wRi= (wSi-fMwMi)/(1-fM). Graphically, when the “correct” value of fM is found, the plot of wRi will be smooth (and linear on a semi-log plot), without a “hump” caused by the excess OBM contaminant. Fig. 2 illustrates the subtraction method.
Another method we use (unpublished to our knowledge) is a hybrid of the MacMillian and Gozalpour methods, requiring OBM composition. It is particularly well suited for reservoir fluids with non-exponential molar distributions that can be described by a gamma distribution model. The subtraction method is applied to obtain an estimate of wRi for an assumed OBM contamination level fM. The back-calcualted wRi amounts are then fit to a gamma distribution model. The quality of fit (e.g. root-mean-square RMS) is minimized when the “most likely” level of contamination (fM) is found.
References
- MacMillan, D.J., Ginley, G.M., and Dembicki, H. Jr.: “How to Obtain Reservoir Fluid Properties from an Oil Sample Contaminated with Synthetic Drilling Mud,” paper SPE 38852 presented at the 1997 SPE Annual Technical Conference and Exhibition, San Antonio, Texas, 5–8 October.
- Gozalpour, F. et al: ‘Predicting Reservoir Fluid Phase and Volumetric Behavior from Samples Contaminated with Oil-Based Mud,’ SPEREE, June 2002, p197-205.
Learn more about our consulting capabilities
###
Global
Curtis Hays Whitson
curtishays@whitson.com
Asia-Pacific
Kameshwar Singh
singh@whitson.com
Middle East
Ahmad Alavian
alavian@whitson.com
Americas
Mathias Lia Carlsen
carlsen@whitson.com
About whitson
whitson supports energy companies, oil services companies, investors and government organizations with expertise and expansive analysis within PVT, gas condensate reservoirs and gas-based EOR. Our coverage ranges from R&D based industry studies to detailed due diligence, transaction or court case projects. We help our clients find the best possible answers to complex questions and assist them in the successful decision-making on technical challenges. We do this through a continuous, transparent dialog with our clients – before, during and after our engagement. The company was founded by Dr. Curtis Hays Whitson in 1988 and is a Norwegian corporation located in Trondheim, Norway, with local presence in USA, Middle East, India and Indonesia