Author: Ilina Yusra, Stian Mydland & Mathias Lia Carlsen
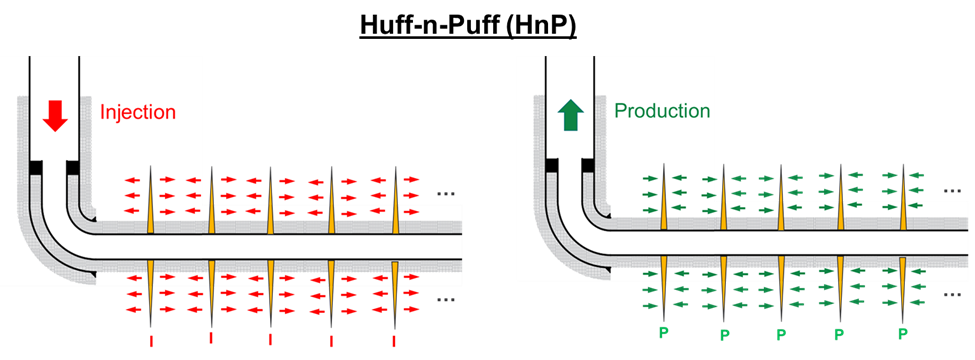
After EOG Resources reported uplift results from their Eagle Ford Huff-n-Puff (HnP) activities, gas injection has gained significant traction in tight unconventionals. The success in the Eagle Ford has led companies to pursue gas HnP in other basins including Permian, SCOOP/STACK, Bakken and Montney. The HnP method is fundamentally different from a conventional displacement process. While a traditional gas injection project relies on injection wells and production wells, the HnP scheme uses a single well that is both injecting (huff) and producing (puff) through the same wellbore, in a cyclic manner.
Mydland et al. (2020) argued through simulation work that the HnP recovery is limited to a potentially small intensively fractured volume (rubblized zone/region) near the main hydraulic fractures. Furthermore, they showed that there is little-to-no recovery achieved outside this fractured rock volume, leaving a potentially large amount of oil behind. This recovery ineffectiveness poses the question: Is HnP the only suitable gas-based EOR process in tight unconventionals? In this article we introduce the so-called “Frac-to-Frac” (F2F) process as an alternative to the HnP process.
What is Frac-to-Frac?
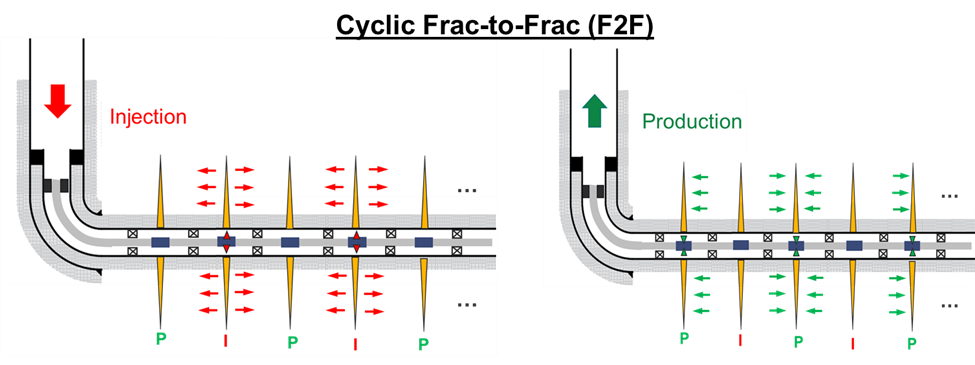
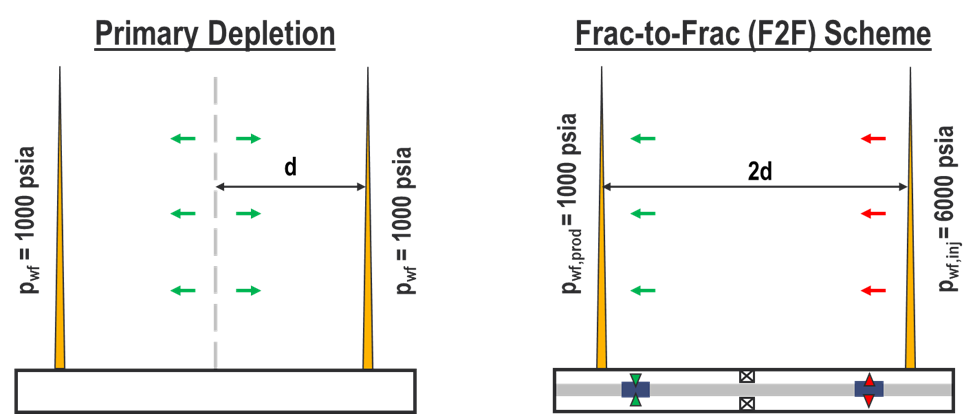
Like HnP, the F2F gas EOR process uses a single well for both injection and production. Many of the operational requirements for F2F (e.g. gas compressor, surface piping, gas processing) are the same as for HnP. The main difference is in the injection and production “points”, as depicted in Fig. 1. Each hydraulic fracture (perforation cluster) is designated for either production or injection, but not both. Oil production is expected to increase by displacing oil with the injected gas from one fracture to nearby fractures. Inflow control devices (e.g. one-way valves) are used to control that the fluid flows appropriately into “injection fracs” and out of “production fracs”.
Appropriate packers are required between individual fracs, or zonal isolation in the F2F process. This is perhaps the greatest challenge for cost-effective and reliable implementation. Likewise, the control valves require special design that balances reliability, functionality, and automation.
Frac-to-Frac—Continuous or Cyclic?
The F2F process can be operated both continuously (injection and production at the same time; “synchronous”) or cyclically (“asynchronous”). In this article we focus on the cyclic version as it has clear technical, operational, and financial benefits compared with the continuous version. Covering all the benefits in detail is beyond the scope of this article. In brief, it is related to more efficient gas utilization, simpler and less costly downhole completion, better gas containment and less-severe gas breakthrough, and reduced gas production.
Frac-to-Frac vs. Huff-n-Puff?
Mydland et al. (2020) showed that the HnP EOR recovery is limited to the size of rubblized zone adjacent to the hydraulic fracture. The rubble size (specifically its minimum dimension) determines the amount of injected gas that enters, mixes, and recovers oil from the rubble pore space. The larger the rubblized zone the more mixing between injected gas and reservoir fluid, resulting in higher HnP recovery. The EOR target volume for F2F is arguably much larger than HnP as it covers the entire volume between the hydraulic fractures
It is not only the absolute target volume that is larger for F2F when compared to HnP, the recovery mechanisms are also fundamentally different.
Because the HnP process is not a displacement process, the key mechanisms behind developed miscibility found in the conventional gas injection literature are less relevant. During the 30-90-day injection periods typically seen in HnP field projects, the main objective is not to displace the oil from a producer to an injector, but rather for the gas to contact and mix with as much oil as possible—dissolving/vaporizing oil components into the gas or mix with and swell the oil. For such a process, the first contact miscibility pressure (MMPFC) is important.
The F2F process is a displacement process in which the multi-contact miscibility (MMPMC) is relevant. For real petroleum systems, the multi-contact miscibility pressure is typically much lower than the first contact miscibility pressure. An example of the difference between first and multi-contact miscibility for three injection gases is summarized in Table 1.
| Injection Gas | MMPFC (psia) | MMPMC (psia) | Multi Contact Mechanism |
|---|---|---|---|
| C1 | 12,308 | 4,805 | Vaporizing Gas Drive |
| 80 mol-% C1 20 mol-% C2 | 8,336 | 4,122 | Condensing/Vaporizing |
| CO2 | 6,222 | 2,657 | Condensing/Vaporizing |
Response Time
Miscible gas injection is associated with near-100% microscopic displacement efficiency (piston displacement). If the macroscopic displacement efficiencies (areal and vertical conformance) are near-100% as well, then the gas injection process will be very efficient. In a multi-fractured horizontal well, characteristic for tight unconventionals, we have long parallel fractures that will create a line-drive (high conformance) type displacement for an F2F configuration.
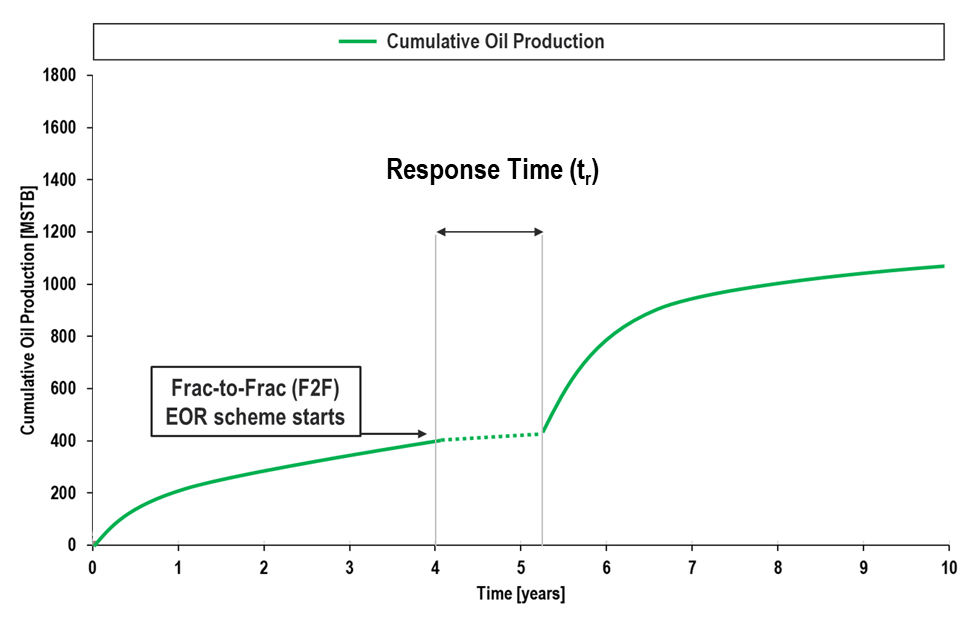
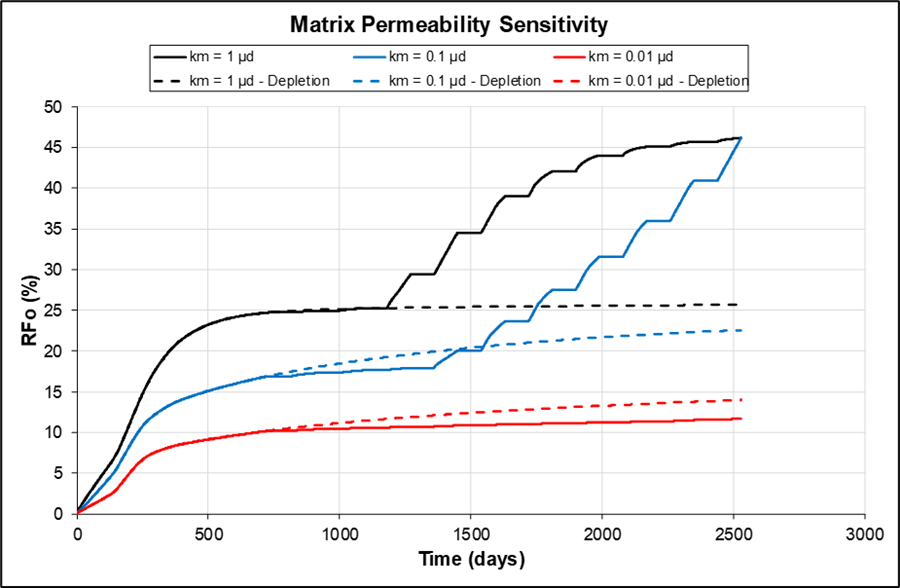
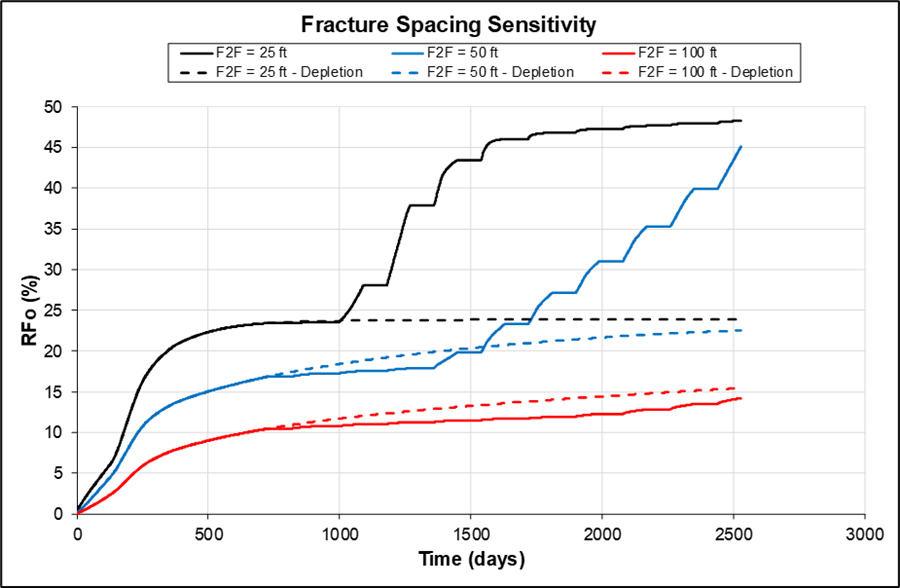
However, the time to observe the true effect of F2F on production (i.e. significant uplift in oil rate) can be significant under certain conditions. We refer to the time from implementation to observing a significant uplift as the response time (tr), as illustrated in Fig. 2. The response time varies with matrix permeability and fracture spacing as depicted in Fig. 3. Delayed response time should be expected with decreasing matrix permeability or as the hydraulic fractures move farther away from each other (tr ∝ d2/k). Pressure depletion (no EOR) is better for some of these cases. However, if we prolong the simulation time, the final recovery factor may be similar. Whether the recovery is worth the wait for a given case should be evaluated with discounted cash flow (DCF) analysis, i.e. incremental NPV.
Can we predict the response time (tr)?
We can estimate the response time with simple diagnostic plots of primary depletion. On a general basis, if interference between fractures (clusters) is what causes deviation from half slope (end of half slope, tehs) on the log-log plot (qo/pwf-pi vs. t), then a good rule of thumb is that the response time will be four times as long, i.e. tr ~ 4tehs. The rule of thumb is supported by order of magnitude analysis using single phase Darcy equation, and is verified with simulation. Single phase, 1D Darcy equation states:
$$\nu=\frac{\partial x}{\partial t}=\frac{k}{\mu}\frac{\partial p}{\partial x}\rightarrow\partial\ t=\frac{\partial x^2}{\partial p}\frac{\mu}{k}$$
Where t is time,
p is pressure,
k is permeability,
μ is viscosity, and
d is distance. During primary depletion, tr indicates the time when the distance of investigation is equal to half of the distance between the fractures, i.e. a distance d as illustrated in Fig. 4. On an order of magnitude basis, Darcy equation can be rewritten for primary depletion to:
$$t_{ehs}∝\frac{d^2}{μk}$$
During the Frac-to-Frac (F2F) EOR scheme, tr indicates when you see production uplift in the production fracture, but the Frac-to-Frac distance is 2d. On an order of magnitude basis, Darcy equation can be rewritten for the F2F scheme to:
$$t_r∝\frac{(2d)^2}{μk}$$
Which results in
$$t_r \sim 4t_{ehs}$$
Summary
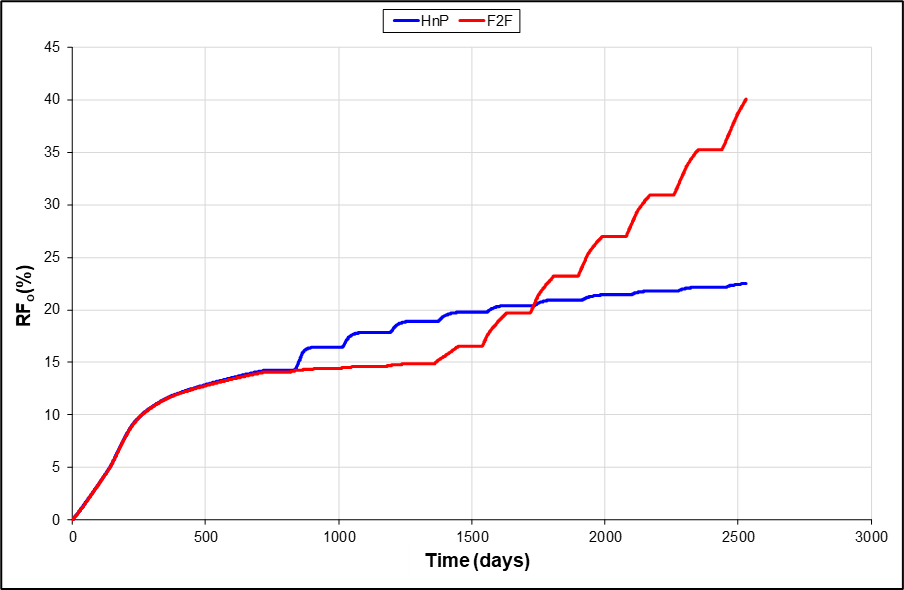
Fig. 5 compares the recovery between the F2F and HnP using a simple simulation model (50 ft fracture spacing, 0.1 µd matrix permeability). Although, the response time for HnP is much shorter compared to F2F, the incremental recovery of each cycle becomes less with time. At the end of simulation, F2F produces nearly three times more than HnP, with a steady significant uplift from the third cycle. The difference in response time will be a major driver in NPV estimation.
HnP and F2F are not mutually exclusive as the two schemes share similar operational requirements, particularly topside. One can always combine the two methods to maximize the potential oil recovery. For example, the gas-based EOR may start with the HnP method and continue with F2F method. The fundamental differences between HnP and F2F are summarized in Table 2.
| Huff-n-Puff (HnP) | Frac-to-Frac (F2F) | |
|---|---|---|
| Recovery Mechanism | Darcy flow, molecular diffusion, and degree of mixing (swelling and vaporization) | Conventional miscible displacement |
| Miscibility Mechanism | First-contact | Multi-contact (e.g. combined condensing/vaporizing) |
| Target Volume | Rubblized region dependent | Volume between hydraulic fractures |
| Response Time | Relatively fast | Can be slow (depends on matrix permeability and fracture spacing) |
| Additional downhole completion | None | One-way valves, packers for zonal isolation, tubing |
| Recommended Completion Type | Plug and Perf (a lot of surface area / “complexity” increases the target) | Pinpoint completion (need to know exactly where the fractures are generated) |
Want to know more?
Warren MacPhail will hold a webinar on this exact technology 3 December 2020, 9-10 Central Time (CT) | 8-9 Mountain Time (MDT) | 4-5 pm Central European Summer Time (CEST). Click here to register: https://bit.ly/3m9w6YQ
Warren MacPhail will share the field study from his time at Devon Energy where he worked on this technology development and field-implementation for almost a decade. The field implementation of this novel approach proves that this is practically possible and carves out the way for the rest of us.
References
Mydland, S., Yusra, I., Whitson, C. H., Dahouk, M. M., Carlsen, M. L. 2020. “Gas EOR Processes in Tight Unconventionals.” Presented at the SPE Improved Oil Recovery Conference, Tulsa, OK, USA, SPE 200396.
Learn more about our consulting capabilities
###
Global
Curtis Hays Whitson
curtishays@whitson.com
Asia-Pacific
Kameshwar Singh
singh@whitson.com
Middle East
Ahmad Alavian
alavian@whitson.com
Americas
Mathias Lia Carlsen
carlsen@whitson.com
About whitson
whitson supports energy companies, oil services companies, investors and government organizations with expertise and expansive analysis within PVT, gas condensate reservoirs and gas-based EOR. Our coverage ranges from R&D based industry studies to detailed due diligence, transaction or court case projects. We help our clients find the best possible answers to complex questions and assist them in the successful decision-making on technical challenges. We do this through a continuous, transparent dialog with our clients – before, during and after our engagement. The company was founded by Dr. Curtis Hays Whitson in 1988 and is a Norwegian corporation located in Trondheim, Norway, with local presence in USA, Middle East, India and Indonesia