This article was written in collaboration with Gerardo Seri from Wintershall DEA.
What is the difference between an MPSR and SPMC bottle?
SPMC stands for single phase multisample chamber, which are nitrogen compensated bottles. The nitrogen is used to maintain the pressure of the bottle at or above the sampling pressure.
MPSR stands multisample production sample receptacle, which are standard bottles, not nitrogen compensated. These bottles experience a reduction in pressure at surface, equivalent to the reduction in temperature (from reservoir to surface temperature).
The decision to sample downhole fluids using SPMC bottles vs MPSR bottles is often based on the potential problem of “lost volumes in the MPSR bottles, that may introduce an error into the GOR and saturation pressure measurements”.
What many engineers designing a sampling program wonder about, is whether the additional cost & time (rig site and lab transfer logistics) required for using SPMC bottles are justifiable due to potential “lost gas in MPSR bottles”?
To shed some light on this issue, this monthly article studies the effect by simulating the potential loss of volume using an EOS model.
It should be mentioned that for fluid systems with potential asphaltene precipitation problems, the measurement of Asphaltene Onset Pressure (AOP) is best made using samples collected in SPMC bottles. If AOP measurement is not relevant (or expected) for a given sample, then even if asphaltenes precipitate, MPSR bottles can be used and a sample of the asphaltenes can be collected from the MPSR bottles for analysis.
How is sample volume potentially lost in an MPSR bottle?
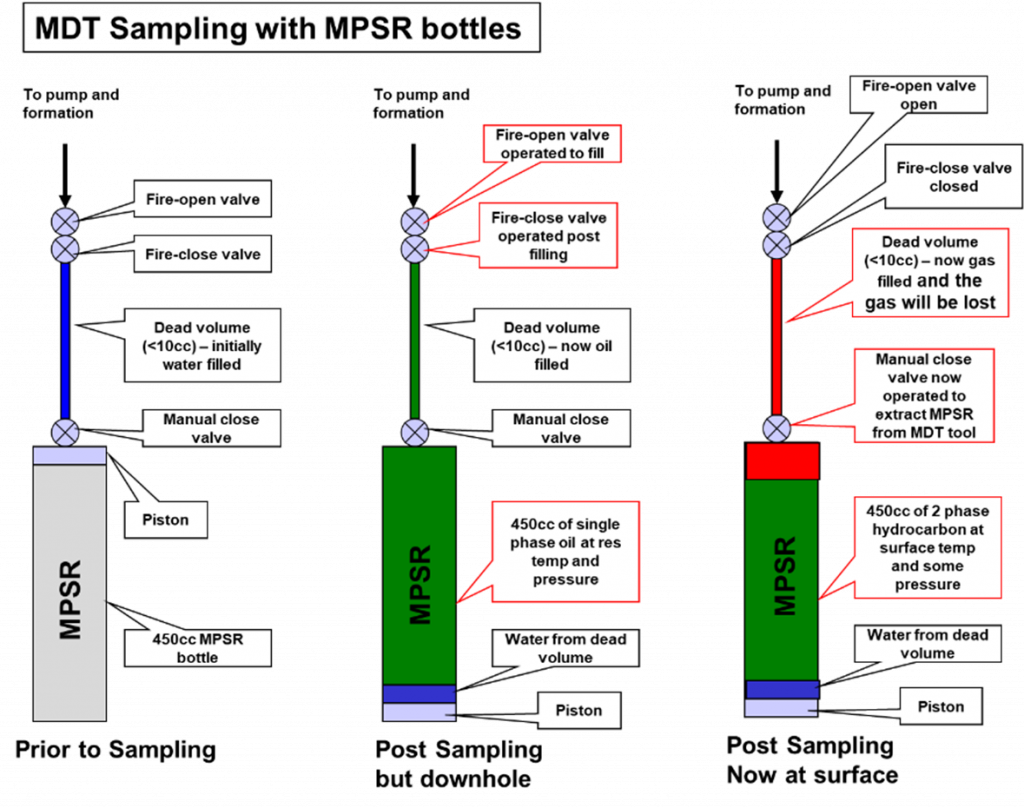
Assume that a sample is collected downhole into an openhole formation test (OFT) bottomhole sampler (at reservoir pressure and temperature). When this sampler is brought to the surface it cools down (surface temperature < reservoir temperature). The temperature reduction will always lead to a drop in the pressure inside the container. At the new equilibrium with lower temperature and pressure, the oil may split into a two-phase gas-oil state to maintain the fixed volume (a so-called iso-volume flash).
When disconnecting the sampler from the tool, depending on the sample bottle’s location within the OFT tool, up to 10 cc of top fluid may be lost. If the fluid in the container is two phase gas-oil when the sample bottle is removed at the surface, then the lost volume will be gas (and potentially some oil). The remaining MDT sample will be too lean in lighter components due to the lost gas volume; the solution GOR and bubblepoint of a reservoir oil will be lower than it should be (compared to the original collected oil). If the original sample was a gas condensate, then the remaining bottle sample will have a slightly too-low GOR (too-high CGR) and a dewpoint that may be higher or lower than the originally-collected sample.
The picture below helps understand the situation:
How to study the problem?
The procedure we used to study this issue is as follows:
- Assume reservoir fluid composition zi
- From the EOS model, calculate number of moles nt of zi needed to fill thetotal bottle volume Vt (e.g. 450 cc) of fluid at downhole reservoir conditions (TR,pR).
- Calculate with an iso-volume flash the bottle pressure (p*) required to contain the same number of nt moles of sampled fluid zi with the same total volume (Vt), but now at ambient temperature (e.g. T=Ta=10oC).
- From (c), calculate the gas and oil volumes (Vg,Vo), molar amounts (ng,no) and equilibrium phase compositions (yi,xi) at (Ta,p*). These conditions exist in the bottle when disconnecting the bottle from the OFT tool and losing some gas volume (ΔVg with moles Δng of composition yi) found in the OFT tool connection line with volume ΔVline.
- Recalculate the fluid composition (zi*) in the bottle after the loss of connection line fluids (gas and possibly oil). If Vg≤ΔVline, all equilibrium gas is lost (together with some equilibrium oil), and the remaining oil in the bottle equals the equilibrium oil composition zi*=xi. If Vg>ΔVline and the disconnected bottle contains two phases with an altered composition zi*=(ntzi-Δngyi)/(nt-Δng).
- Use zi* to predict GOR at standard conditions, saturation pressure and other relevant phase behavior, comparing with the values obtained to the original single-phase sample (zi).
Using a generic EOS model we ran the procedure above for several reservoir fluids using the following assumptions:
- Downhole pressure of of pR=500 bara
- Downhole temperature of TR=85 C
- MPSR sample bottle volume Vt=415.6 cc
- Connection line volume ΔVline , lost volume = 6.2 cc
These conditions allowed us to study oils up to a GOR of 3000 scf/STB (535 sm3/sm3); higher GORs resulted in the reservoir fluid being 2-phase at the assumed reservoir pressure (ps>500 bara). It is worth noting that these are the assumptions for our assessment of the issue, but different vendors have different bottle volumes and different lost volumes when the bottle is disconnected from the sampler.
Results and Conclusions
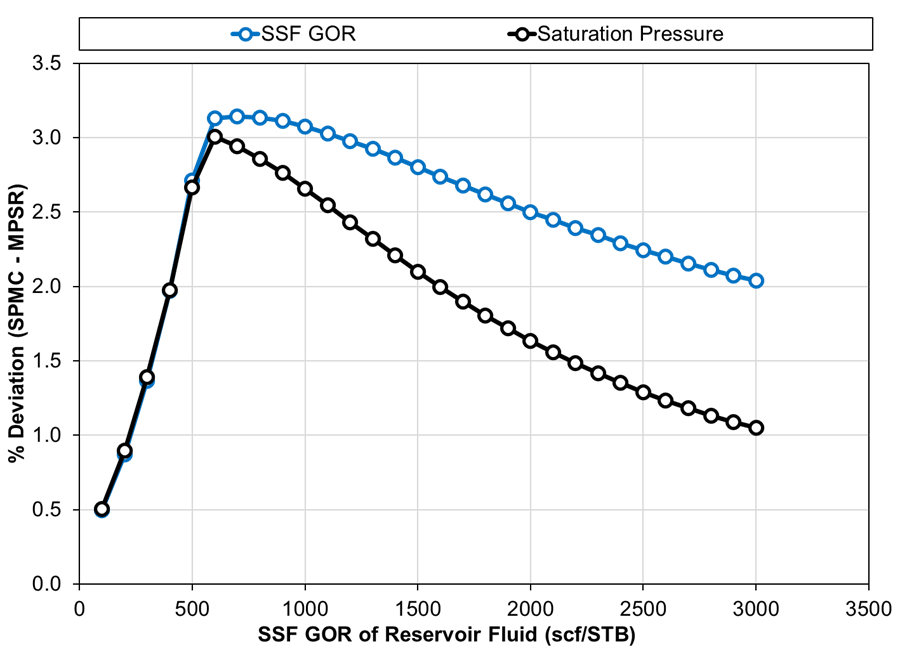
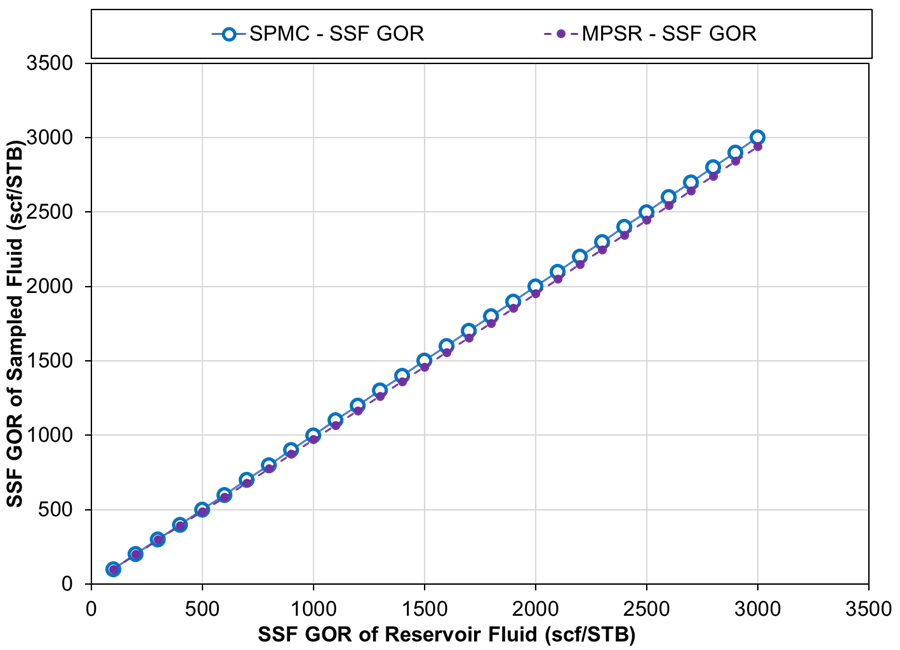
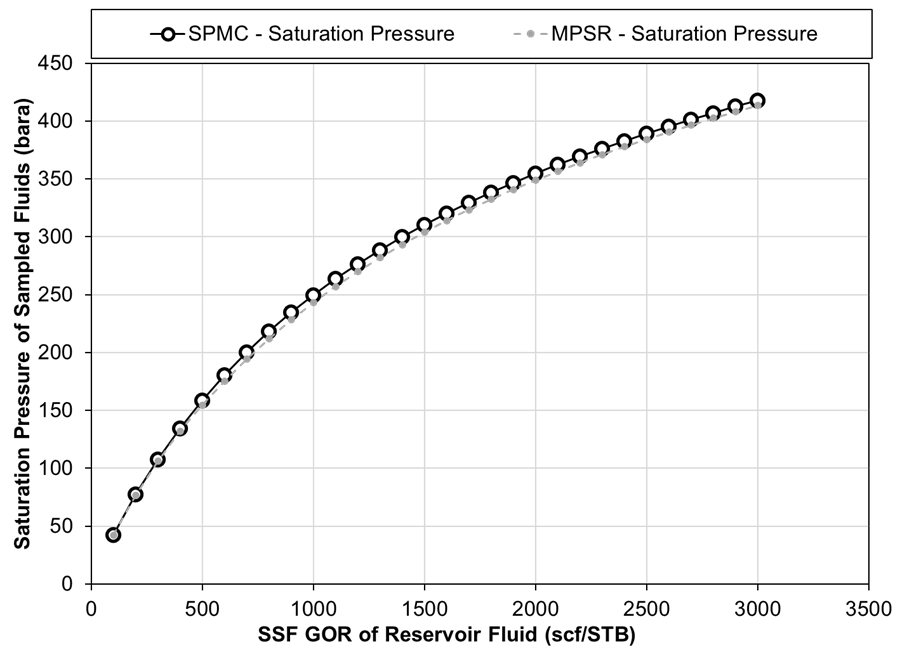
The results show that the lost gas in the MPSR bottle can lead to up to 3% error in the saturation pressure of the fluid and the single stage flash GOR of the fluid. Notice here that for GORs below 500 scf/STB, there is less than 6.2 cc of gas at surface and therefore all the gas is removed (lost) from the bottle.
The deviation between the MPSR and SPMC results is larger for lower GOR fluids, as we are removing a fixed volume of gas from the MPSR bottles, and the lower GOR fluids will be more affected by this (percentagewise). In addition, the main factors affecting the results will be the GOR of the fluid, the downhole conditions and the ambient surface temperature.
Bottomline, the magnitude of error in fluid properties caused by the loss of free gas does not have an impact for obtaining accurate and useful PVT data to develop an EOS models. As a reference, the errors one would see from the lost volume are not even larger than the typical measurement error expected from PVT laboratories. Our internal guidelines at whitson are that saturation pressures are generally within +/- 5 bar (gas condensate samples might have larger uncertainties); while GORs generally are within 5-10% (could be higher for leaner gas condensates).
Using a reliable EOS model with the slightly-too-low-GOR sample composition, it is easy to make similar calculations to those given here. This should result in an excellent estimate of the GOR and composition of fluid that was actually collected in the OFT bottle before loss (and likely in-situ representative). With the corrected sample composition, the “lost” PVT properties between the incorrect sample found in the removed bottle, and the original sample that entered the bottle, can readily be calculated by the EOS model.
Perhaps the most important consequence of sample errors due to lost gas in MPSR connection lines is for exploration wells containing near-saturated oils, where the estimation of a potential gas cap must be made. The sensitivity of GOC depth to saturation pressure may be 2-20 m/bar, meaning that a 5 bar underestimation in bubblepoint could lead to an error in estimated GOC of 10-100 m, equaling the same error in estimated oil column thickness (see Eqs. 20-21 in SPE 63085). A correct GOC estimation should be made with the EOS gradient calculation using the corrected composition zi that represents the sample originally collected with the OFT tool (before gas loss in the transfer line).
Learn more about our consulting capabilities
###
Global
Curtis Hays Whitson
curtishays@whitson.com
Asia-Pacific
Kameshwar Singh
singh@whitson.com
Middle East
Ahmad Alavian
alavian@whitson.com
Americas
Mathias Lia Carlsen
carlsen@whitson.com
About whitson
whitson supports energy companies, oil services companies, investors and government organizations with expertise and expansive analysis within PVT, gas condensate reservoirs and gas-based EOR. Our coverage ranges from R&D based industry studies to detailed due diligence, transaction or court case projects. We help our clients find the best possible answers to complex questions and assist them in the successful decision-making on technical challenges. We do this through a continuous, transparent dialog with our clients – before, during and after our engagement. The company was founded by Dr. Curtis Hays Whitson in 1988 and is a Norwegian corporation located in Trondheim, Norway, with local presence in USA, Middle East, India and Indonesia