By Stian Mydland, May 2021
The flowing wellbore pressure at the perforated interval, commonly referred to as bottomhole pressure (BHP | pwf) or sandface pressure, is a required input for all classical well-performance forecasting techniques. The BHP is available in real-time for wells having pressure gauges installed sufficiently close to the perforated interval. For wells without gauges, the BHP is estimated by multiphase flow correlations.
Wells in tight unconventionals, for example, are seldomly completed with pressure gauges downhole, and so calculation of the BHP is an everyday task for engineers in the tight unconventional space of the industry. By knowing the production rates and pressure at the outlet of the well (i.e. the wellhead), one can use the following equations to estimate the pressure- and temperature gradient in the wellbore by numerical integration
 | (1) |
 | (2) |
The challenge with Eqs. and lies in determining the different variables, particularly if the flowing fluid is not single phase, as most of these variables are both pressure and temperature dependent. Numerous correlations have been developed to describe multiphase flow in inclined pipe, where some of the most-commonly used correlations are due to
- Duns and Ros (1963)
- Hagedorn and Brown (1965)
- Beggs and Brill (1973)
- Gray (1974).
Common to these correlations is that they provide ways of calculating two key properties for pipe flow, the liquid hold-up (HL), and the two-phase friction factor (ftp).
Pipe flow calculations involve describing the fluids (oil, gas, water) at different pressures and temperatures, usually done with the black-oil PVT model. Black-oil tables are generated at a specified temperature, so to capture the fluid-property variation with temperature, one has to create at least two tables to span the temperature range. Creating multiple black-oil tables can be an obstacle when the task at hand is to obtain simple and fast well-performance forecasts. Therefore, black-oil correlations are often used instead to simplify the procedure of calculating the BHP.
It is well known from reservoir modeling that black-oil correlations can be a sufficient alternative in lieu of an equation-of-state (EOS) generated black-oil table, if the initial reservoir fluid is a low-GOR (<1000 scf/STB) oil. Such fluids can be modeled accurately with the traditional black-oil PVT model (i.e. the gas phase has no oil in solution, Rv = rs = 0 STB/MMscf). For volatile oils and gas condensates, the assumption of a dry gas phase is no longer valid, and black-oil correlations will predict the fluid properties poorly (even after tuning the correlations).
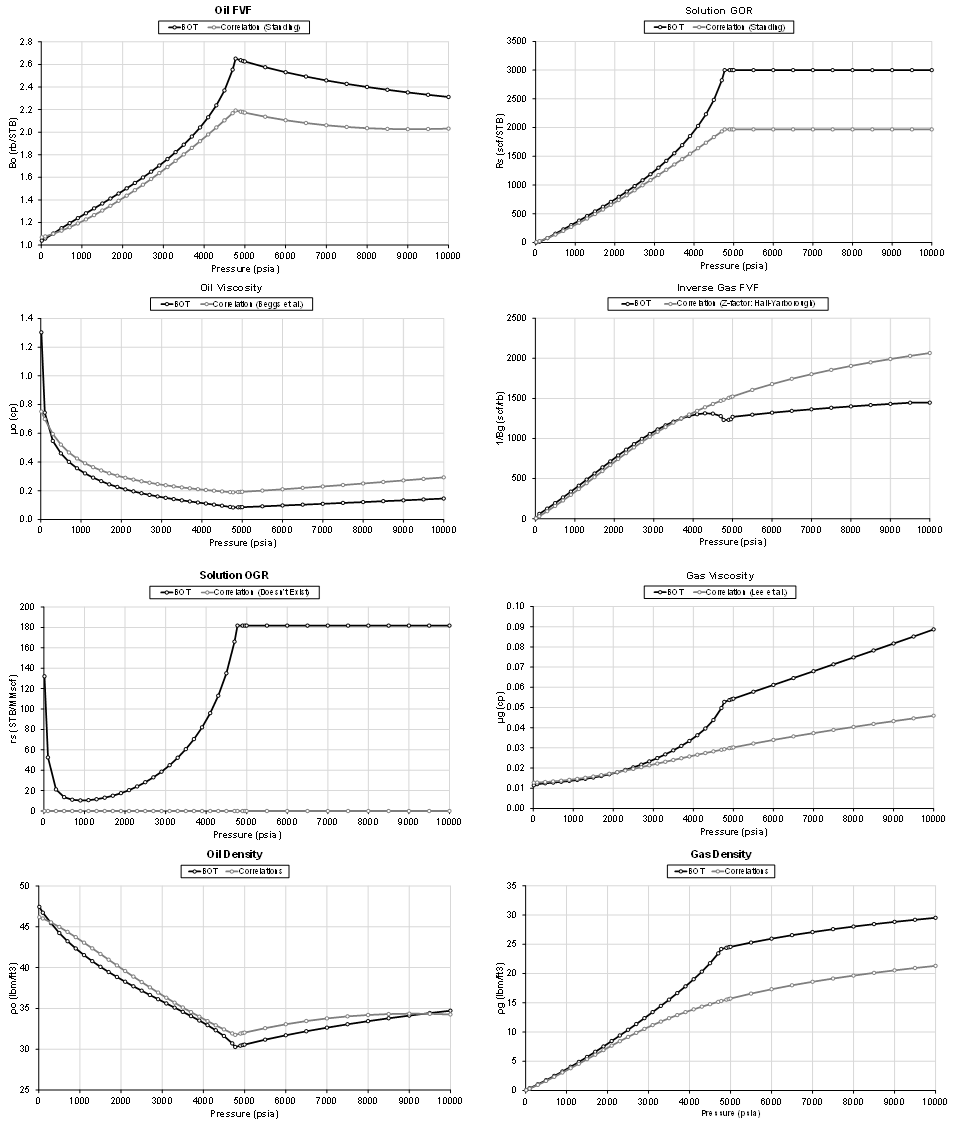
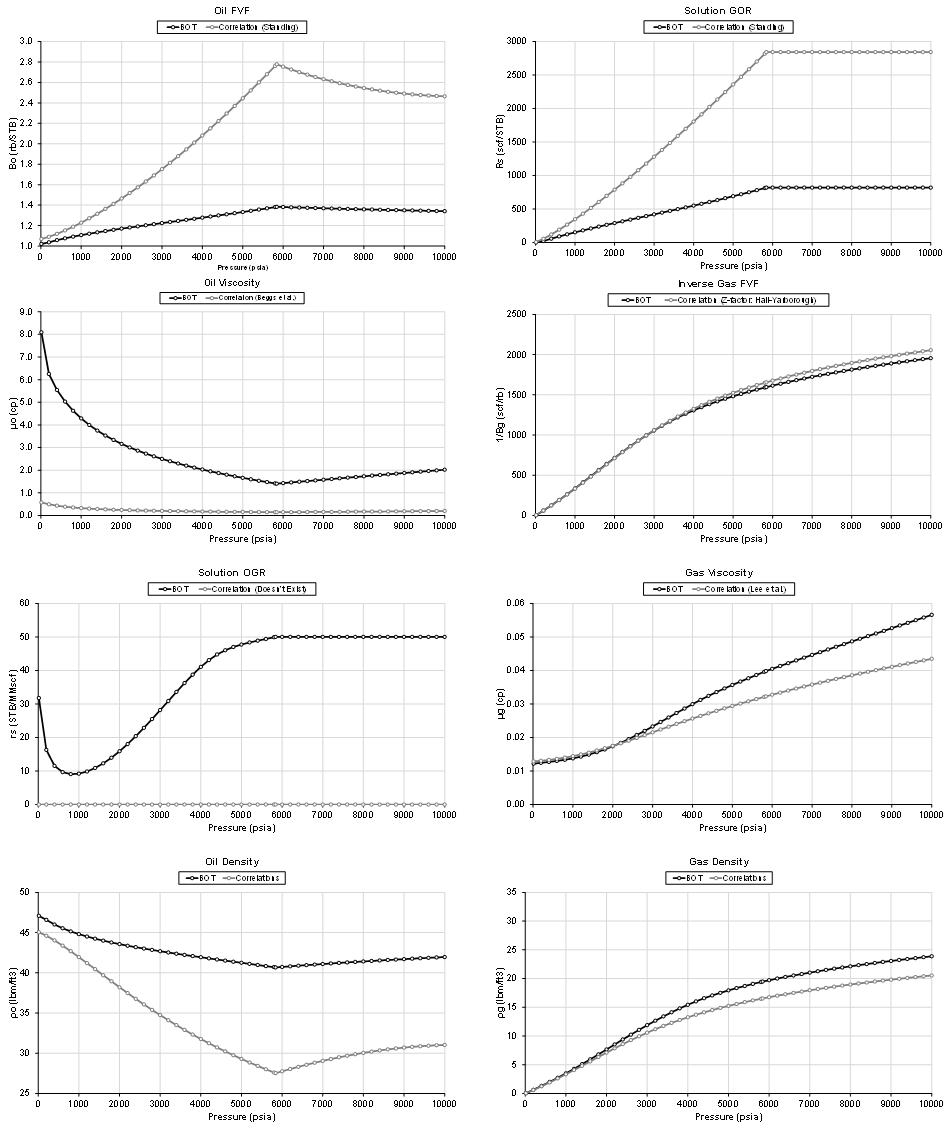
A comparison of calculated black-oil properties from correlations versus a tuned EOS of two fluid systems, (1) a 3000 scf/STB oil, and (2) a 50 STB/MMscf (20000scf/STB) gas condensate, are shown in Figs. 1 and 2. We see that there are large differences in the predicted black-oil properties. For reserves estimation and in reservoir simulation, such differences in black-oil properties would have a large impact on the calculations. However, do these differences in black-oil properties matter for BHP calculations?
Figs. 3 and 4 show calculated BHPs for the two fluid systems in Figs. 1 and 2. For the 3000 scf/STB oil, we have used the Hagedorn and Brown correlation, and for the 50 STB/MMscf gas condensate, we have used the Gray correlation. To test the effect of production rates, we have calculated BHPs for production at conventional scale (labeled high rate), and unconventional scale (labeled low rate). We see that, despite there being large differences in the black-oil properties, there is a negligible difference in the calculated BHP. The small differences observed early time coincide with where the difference in the black-oil properties is largest. Without going into much detail as to why, these results were generally expected. Most of the BHPs are in the pressure range where correlations match the EOS calculated black-oil properties reasonably well, at least for the dominate phase flowing in the well. For the 3000 scf/STB oil, correlations and EOS-predicted black-oil properties match well at pressures <3000 psia for both gas and oil phases. For the gas condensate, the oil (condensate) properties are not predicted accurately by the correlations at any pressure, but the BHP is little affected by this because the dominant phase in the pipe will be gas, for which the black-oil properties are predicted well with the correlations.
The results shown here raise the question of why ever use EOS-calculated black-oil tables, when correlations appear to be just as good? The answer to that is consistency. If one decides to use a rigorous fluid description in the reservoir modeling, either directly through compositional reservoir simulation, or by using black-oil tables calculated from a tuned EOS, and then use correlations for the BHP calculations; then one introduces a potentially large inconsistency in describing the same fluid in two different, but connected, parts of the production system. In addition, even though the examples here indicate that there is little difference in the calculated BHPs, there is no guarantee that the correlations will always yield results similar to those calculated with a rigorous fluid model. For any, and all, calculations where fluid properties need to be calculated, we recommend to always use either black-oil tables generated by an EOS (preferably tuned), or the EOS itself, consistently throughout every calculation in the production system (from reservoir to surface).
PS! Did you know you can calculate bottomhole pressures daily in our software platform, whitson+? Contact us here for more info: https://whitson.com/contact-us/
| Oil (Rsi = 3000 scf/STB) |
 |
| Gas Condensate (rsi = 50 STB/MMscf) |
 |
 |
 |
Learn more about our consulting capabilities
###
Global
Curtis Hays Whitson
curtishays@whitson.com
Asia-Pacific
Kameshwar Singh
singh@whitson.com
Middle East
Ahmad Alavian
alavian@whitson.com
Americas
Mathias Lia Carlsen
carlsen@whitson.com
About whitson
whitson supports energy companies, oil services companies, investors and government organizations with expertise and expansive analysis within PVT, gas condensate reservoirs and gas-based EOR. Our coverage ranges from R&D based industry studies to detailed due diligence, transaction or court case projects. We help our clients find the best possible answers to complex questions and assist them in the successful decision-making on technical challenges. We do this through a continuous, transparent dialog with our clients – before, during and after our engagement. The company was founded by Dr. Curtis Hays Whitson in 1988 and is a Norwegian corporation located in Trondheim, Norway, with local presence in USA, Middle East, India and Indonesia
