Author: Markus Hays Nielsen
The most critical part of making a fluid model for petroleum mixtures is the C7+ characterization. We will be publishing a set of articles on this topic where we go through all the nitty-gritty, but for now we just wanted to get in the mood by becoming more familiar with the gamma molar distribution model. This article will cover what the gamma model is, what the input and outputs are, and ultimately guide you through how you can change its parameters to fit real data.
What is the gamma molar distribution model?
Breaking down the name of the model part-by-part is always a good first step. Let’s start with the last word “distribution”. A distribution gives the shape of how frequent one finds a situation with a particular value for the independent variable. The variable in our application is the molecular weight (MW) of compounds in a hydrocarbon mixture. If we start with a mixture having its lightest hydrocarbon with a molecular weight of 100 g/mol, one might find 32% of all molecules in the oil within the limited MW range 100-110 , while only 2% of the molecules lie in the MW range 200-210, 0.8% of the molecules in the MW range 300-310, and 3.6% of molecules with MW greater than 500.
A more formal definition is not really useful here, and so we will just go with this for now. The properties that we care about is the total area under the curve sums to 1, and that all values are positive. Moving on to the next word “gamma”, which refers to the specific distribution that is used, namely the gamma distribution (see here for details). The reason for the “gamma” in the gamma distribution model is because it uses the nasty looking gamma function (Γ). The naming isn’t great, but it’s too late to change now. For reference, you can see an amazing video that derives the Gamma function in an intuitive and visual way here. The last word that we need to cover is molar. To explain this, we need to understand what the input and outputs are in the model. Animation 1 below shows a plot of the continuous gamma molar distribution model, where the x-axis is molecular weight and the y-axis is molar (or mole) composition. This is where the term “molar” comes from in the gamma molar distribution model, and it is also the reason why we want a distribution and not just any old function (because the mole composition also has the constraint of summing to 1 and always being greater than or equal to zero).
The model parameters in the continuous gamma molar distribution model are
- The shape (α)
- The bound (η)
- The average molecular weight, Mavg
Your first task is to use this link and change these three parameters to see what effect it has on continuous gamma molar distribution model. You can also see an example of this below.
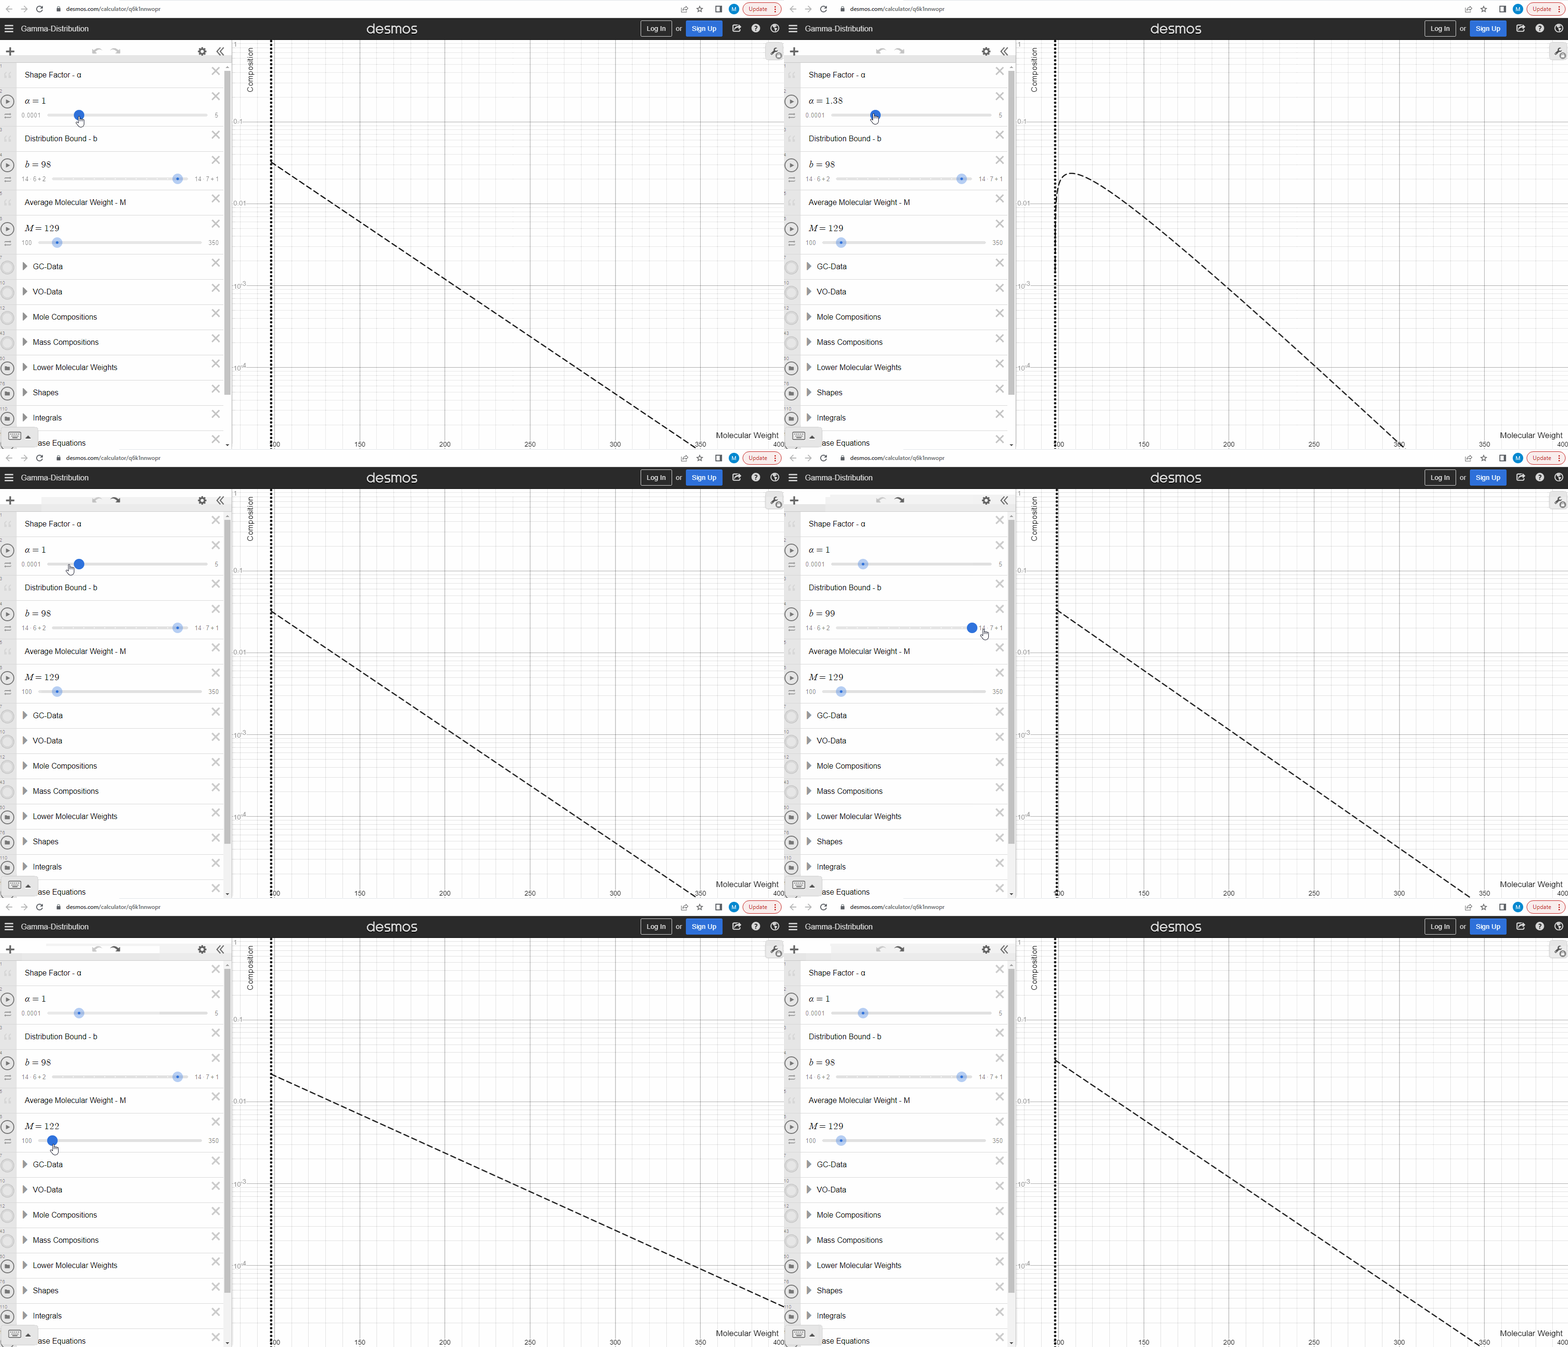
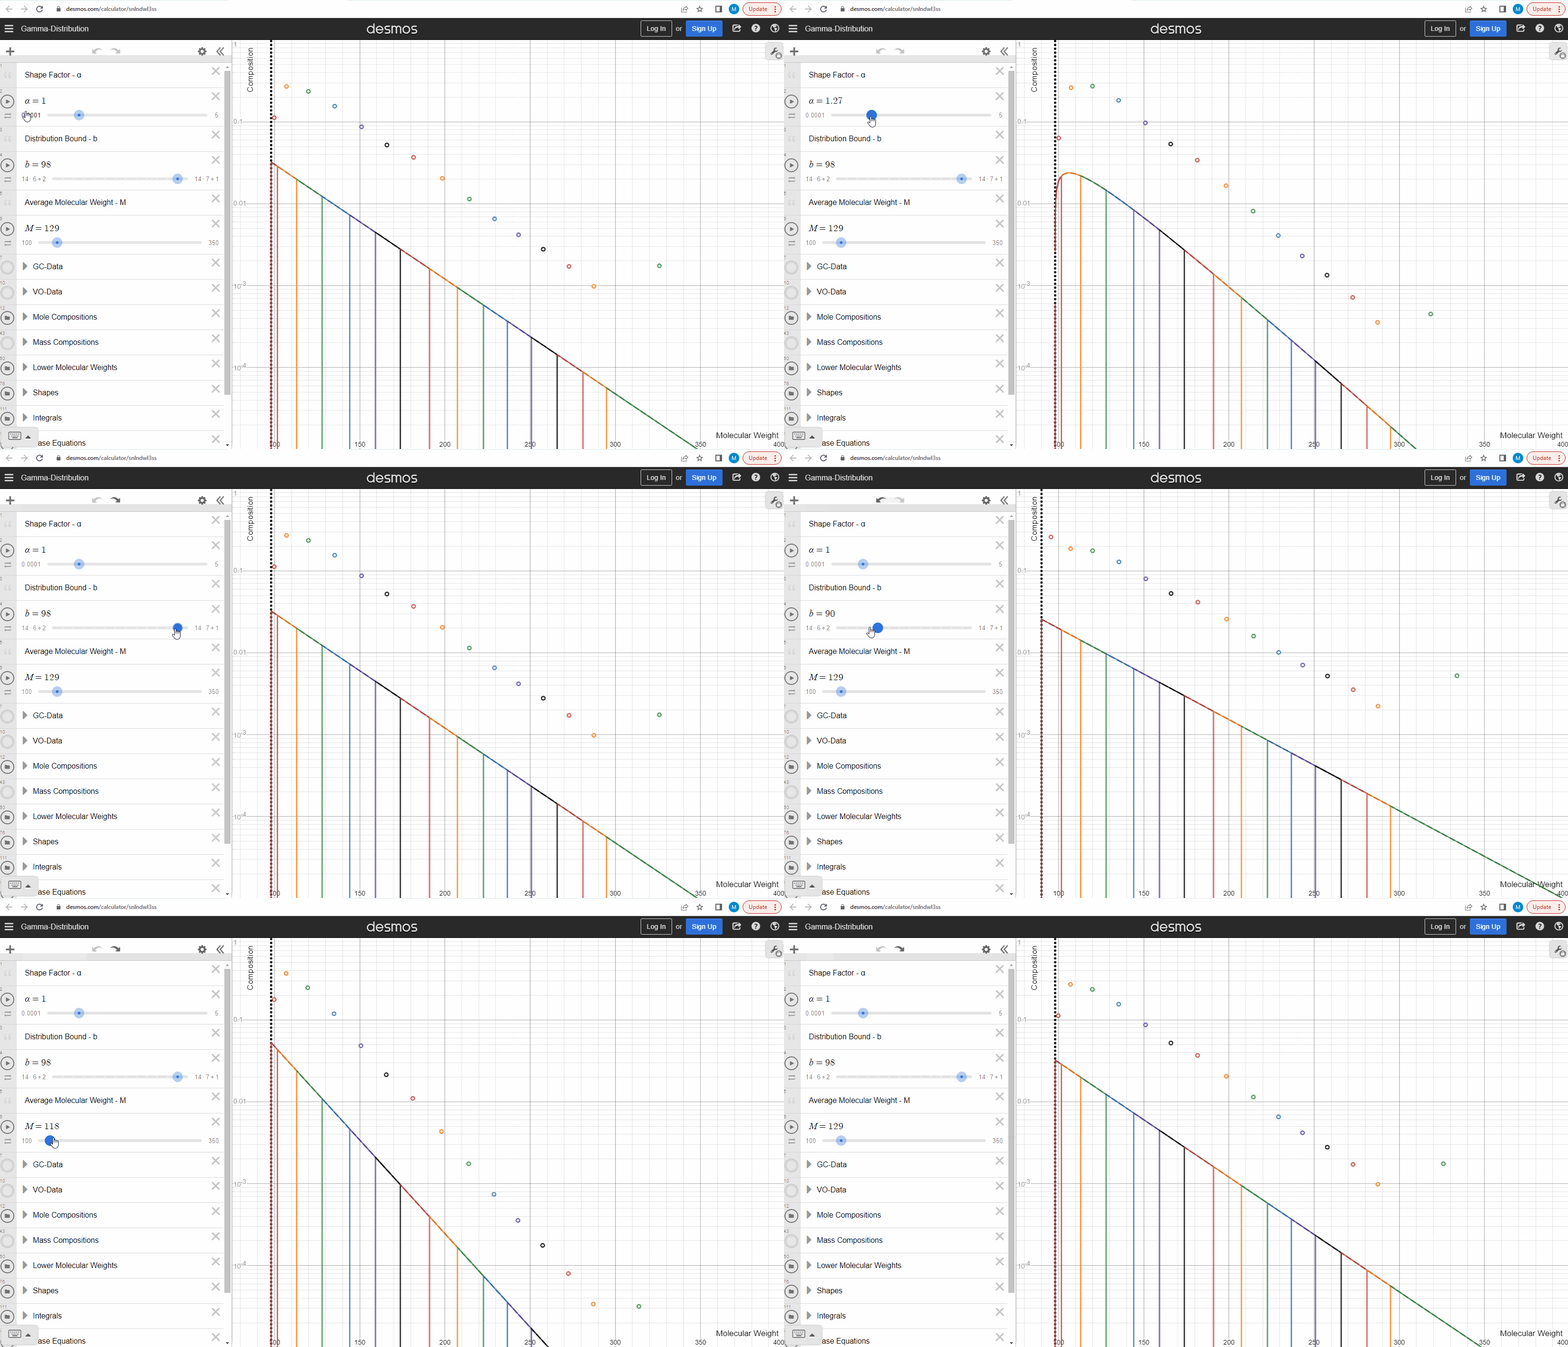
We specify that the gamma model above is continuous, because the results that we actually use for our predictions of mixture compositions are not continuous, but a discrete version of the gamma distribution model. So how do we discretize the the gamma model? By specifying a certain number of molecular weights on the x-axis called lower molecular weights (LMWs) starting at the bound (η). The mole composition for a component can then be defined as the area between two neighboring LMWs. This is illustrated here where one component is isolated between two molecular weights in the continuous gamma model and the mole composition for that component is shown as a circle. The molecular weight for the discrete model can also be calculated using an averaging rule, but is beyond the scope of this article. You can look under the hood of the interactive tool to see the details if you are interested!
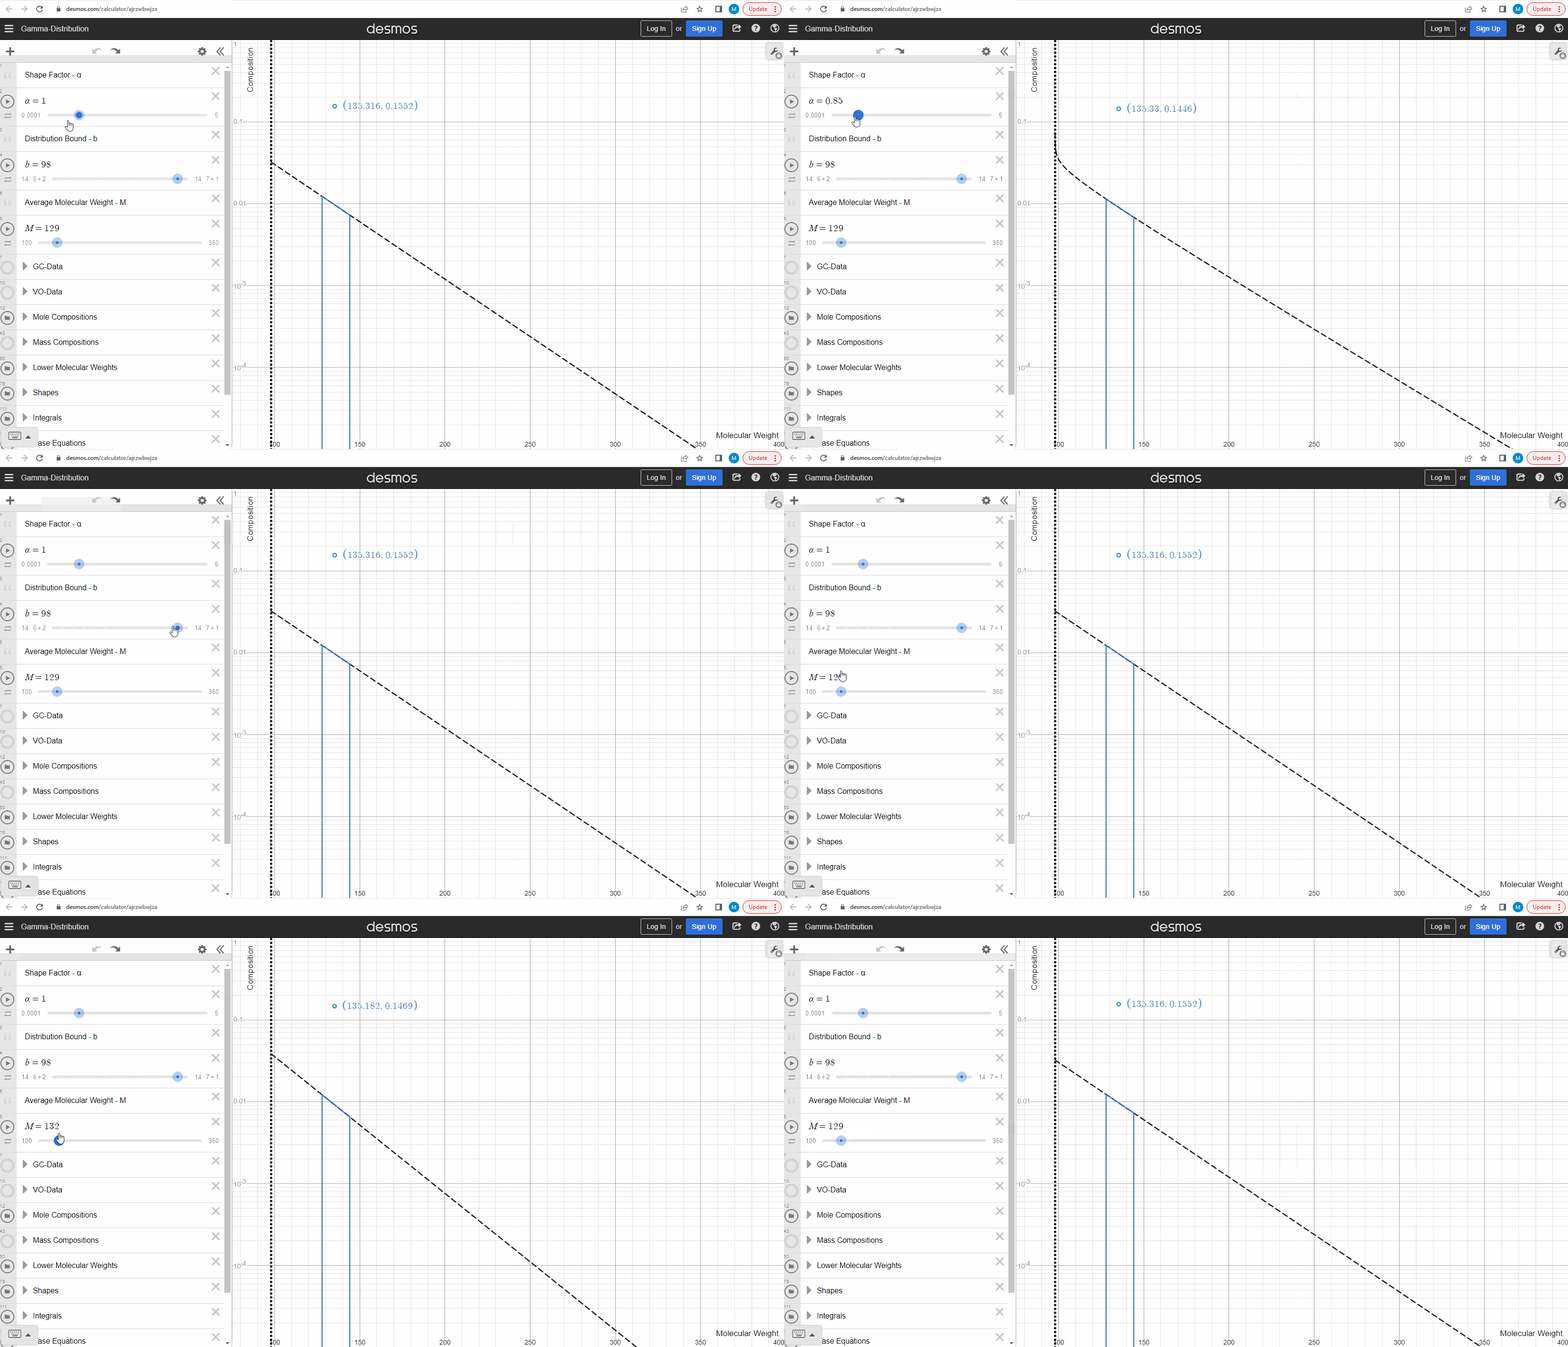
Having discretized the gamma model let’s try to change the model parameters again to see how the parameters affect the mole composition. You can test this here. If you want an extra challenge, you can go in and change the LMWs to see what effect this has on the discrete model.
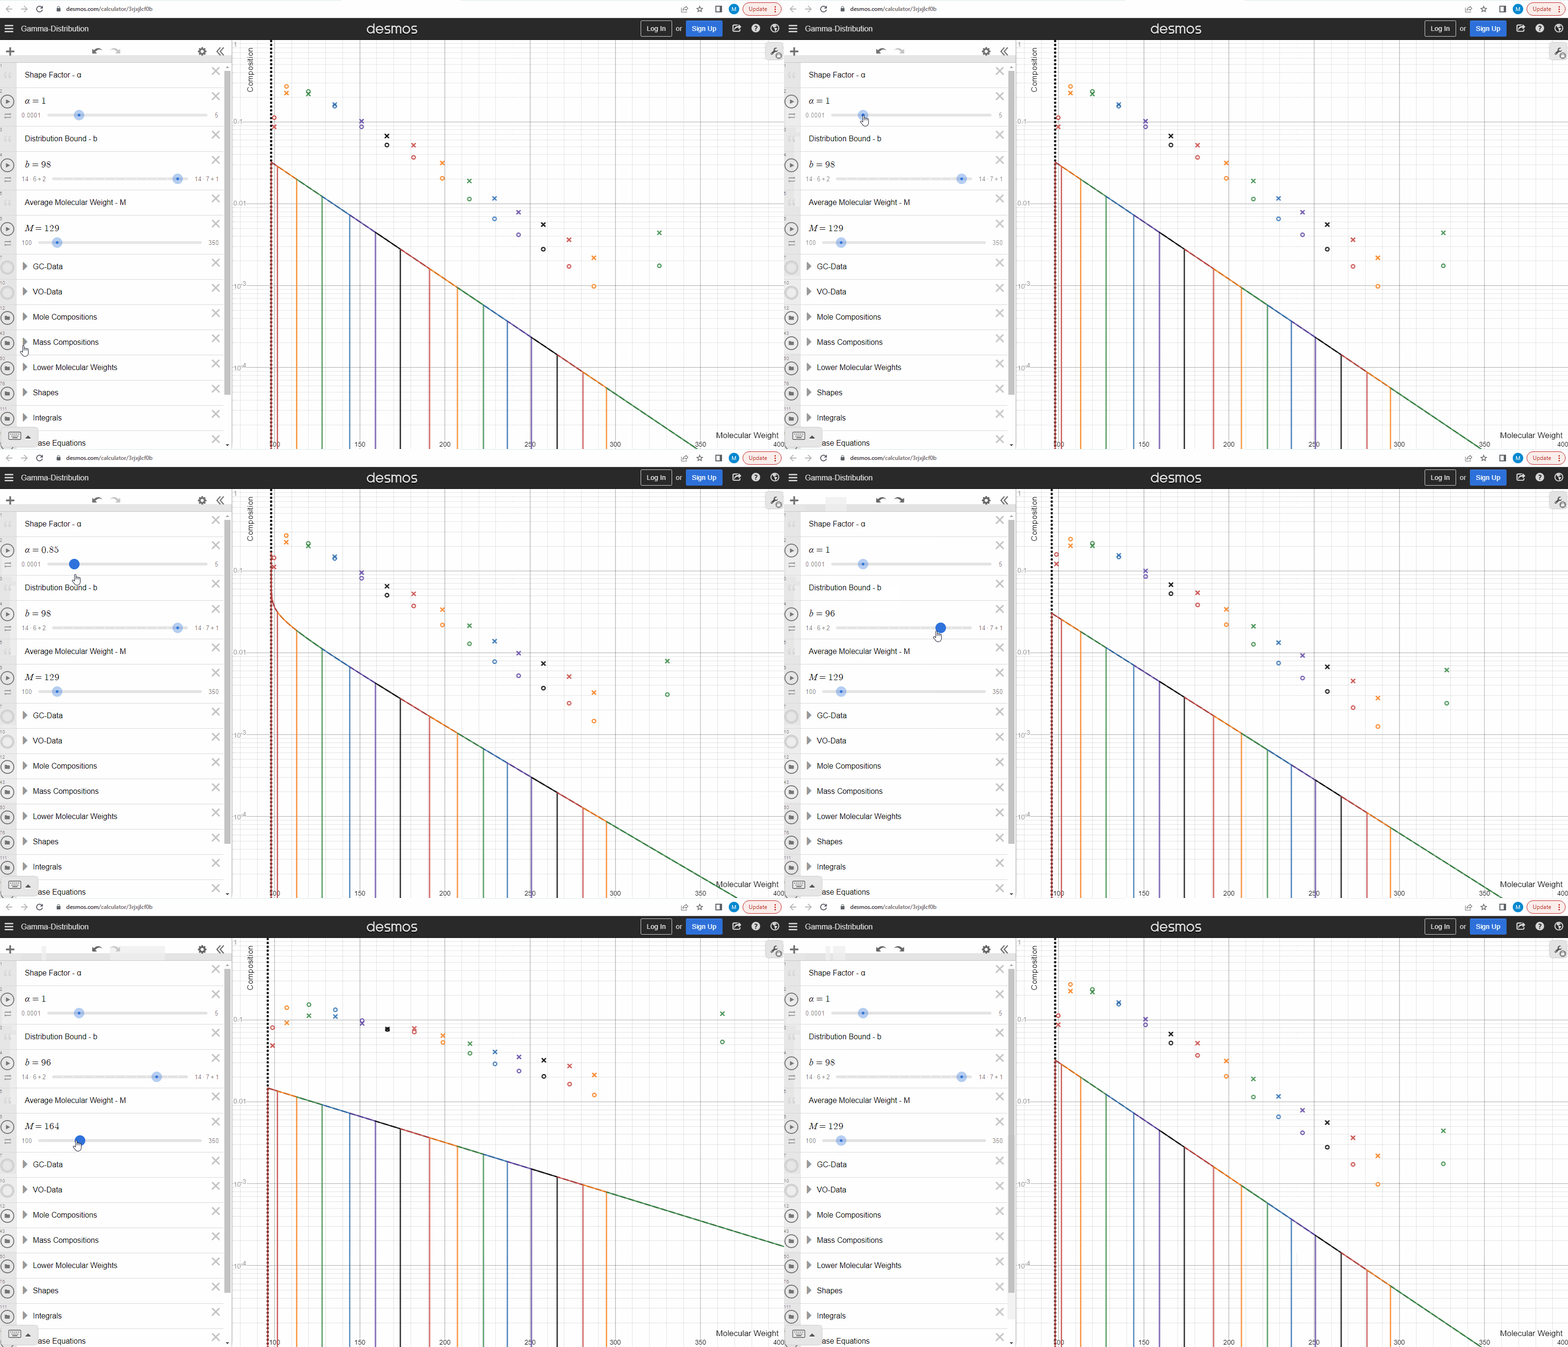
The discrete gamma model we have looked at so far gives a mole composition, but the laboratory measured C7+ compositions are measured as mass compositions and not mole compositions. So if we want to match the measured data, we need to convert from mole to mass composition. Luckily the discrete gamma model gives mole amounts and molecular weights, and so it is possible to calculate the mass composition from these two values! You can test and see what this looks like here where the crosses are the mass amounts and the open circles are the mole amounts.
Using the gamma model to predict data
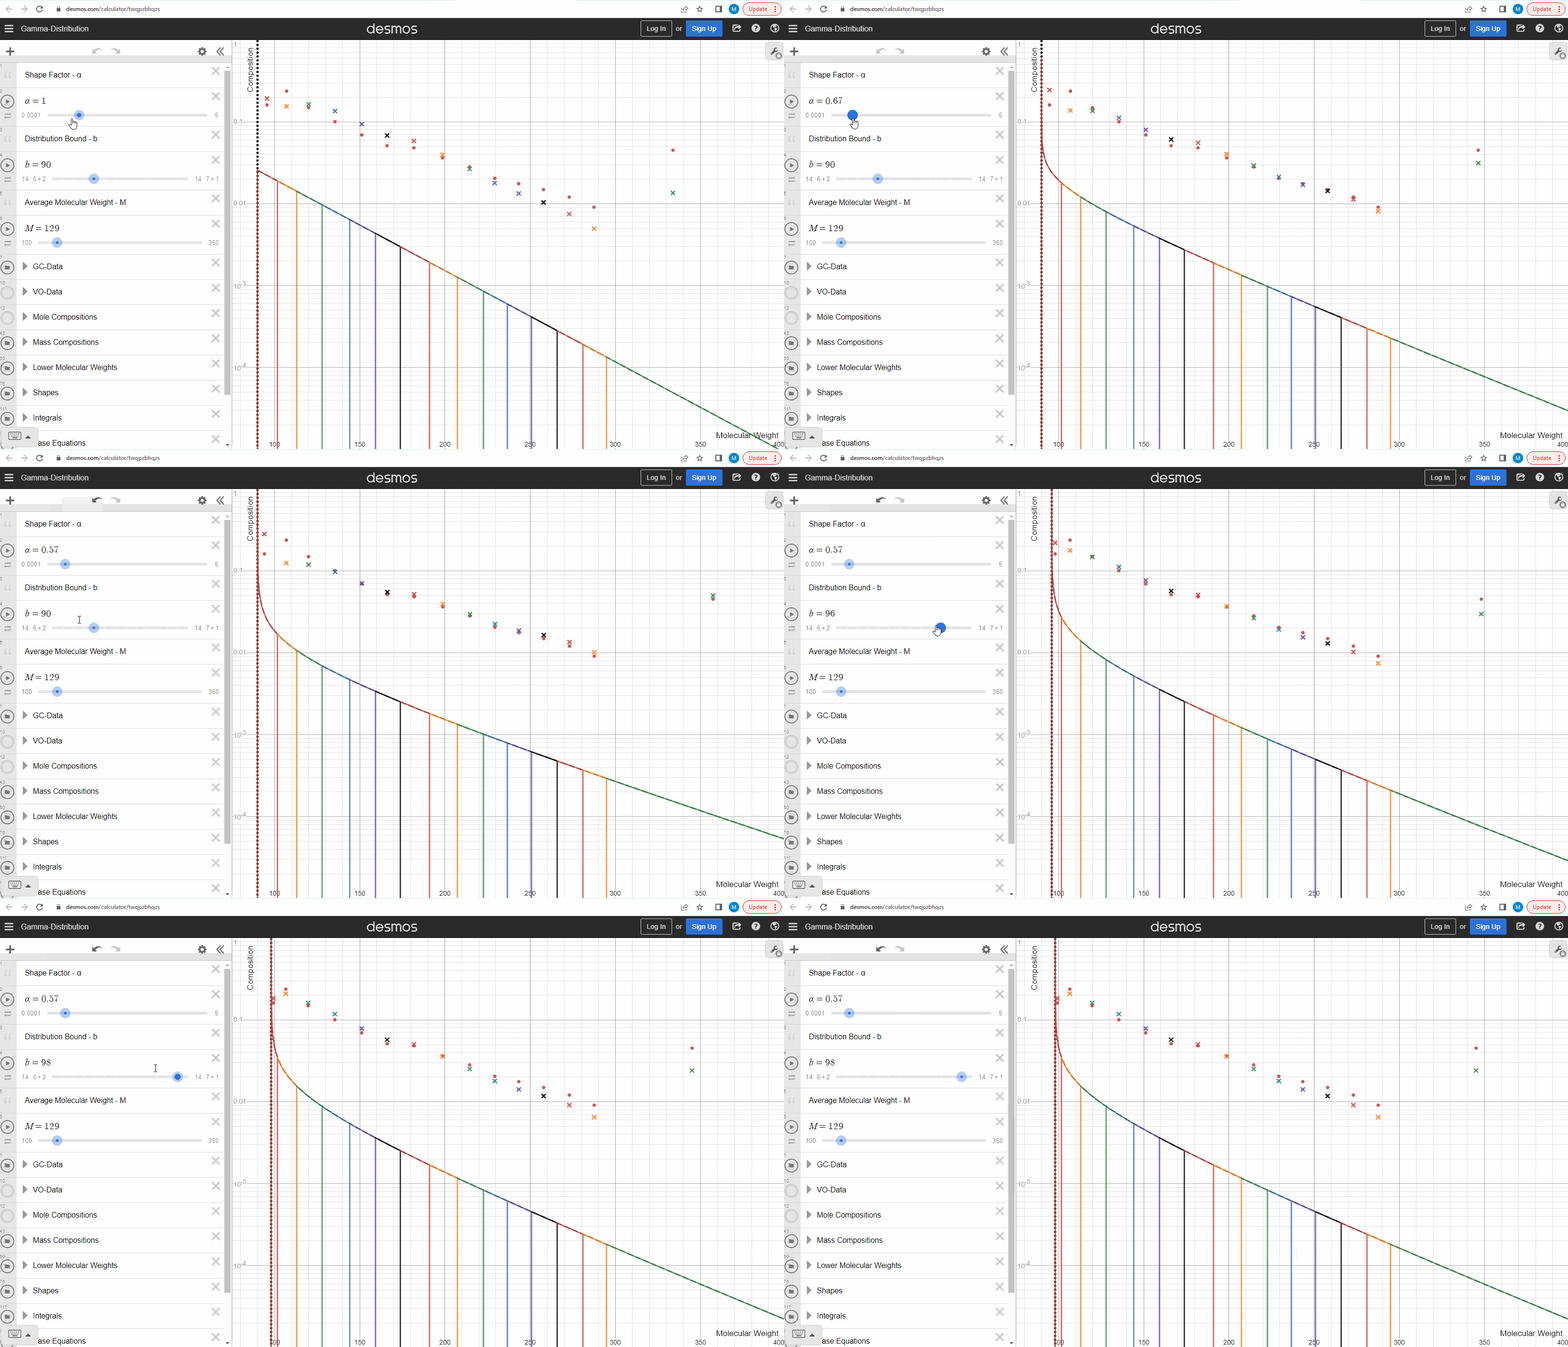
Now that we understand how we can get mass compositions from the continuous gamma molar distribution model, we can try to use it to match some real data! Your task is to change the shape (α) and bound (η) here to match the measured data (red filled circles). This data is from a sample which comes from a flashed oil at 1 atm and ambient temperature derived from a reservoir gas condensate fluid. Using your model parameters, try to predict the second sample (green filled circles) by only changing the average molecular weights and leaving the model parameters constant. Were you able to predict the second sample? Try our model here to see that this actually works! How did your results differ from ours?
What can you use the gamma model for?
There are many use cases for the gamma model once the above exercise of fitting the model to data is complete. Some of the most important cases are summarized below:
- QC compositional data from the lab – If the data is of questionable quality, you can salvage the associated PVT measurements by replacing the suspect data with the gamma model predictions.
- Mud decontamination – Using a tuned gamma model can give more accurate estimate of mud contamination than the commonly used “straight line” method that does not honor the real deviations from a straight line that all hydrocarbon systems have to a greater or lesser degree.
- Can give estimates of the component molecular weights to convert from mass to mole composition, particularly C7+.
- Ensuring consistency with distillation data.
Summary
In this article we have gone through the main principles of the gamma molar distribution model, from its continuous form to how we get the discrete mass compositions. With this knowledge, we tried to tune the gamma model to real data and see how well it could predict another sample from a different fluid by only changing the average molecular weight. What we hope that you come away from in this article with is that you know what the gamma model is, how it works, how it can estimate mass compositions, and how you can match the model to real measured data to create a predictive compositional model. This article is not an in-depth study of the gamma model, and we would not use this tool in our consultancy projects, but it is meant to illustrate the key relationships within the gamma model, and to hopefully help you build some intuition about what usually is a pretty complicated and abstract topic!
Thanks for reading!
Note:
This article was based on the original paper by Curtis Hays Whitson that can be found here.
###
Le Learn more about our software products
Global
Curtis Hays Whitson
curtishays@whitson.com
Asia-Pacific
Kameshwar Singh
singh@whitson.com
Middle East
Ahmad Alavian
alavian@whitson.com
Americas
Mathias Lia Carlsen
carlsen@whitson.com
About whitson
whitson supports energy companies, oil services companies, investors and government organizations with expertise and expansive analysis within PVT, gas condensate reservoirs and gas-based EOR. Our coverage ranges from R&D based industry studies to detailed due diligence, transaction or court case projects. We help our clients find the best possible answers to complex questions and assist them in the successful decision-making on technical challenges. We do this through a continuous, transparent dialog with our clients – before, during and after our engagement. The company was founded by Dr. Curtis Hays Whitson in 1988 and is a Norwegian corporation located in Trondheim, Norway, with local presence in USA, Middle East, India and Indonesia
