Author: Markus Hays Nielsen
In order to describe the behavior of petroleum fluids, an accurate and consistent fluid model is needed. Different fluid systems can behave significantly differently during depletion of the reservoir and throughout the downstream system. The aim of the following articles is to describe what makes different fluids behave differently and how to develop fluid models that are characterized to describe this behavior in a consistent manner. This task does not have a unique solution; therefore, the aim is not to give one single solution that will handle all cases, but rather to give a framework that honors the fundamental principles and as much data as possible, such that good engineers can more easily create better and more consistent models.
This first article will describe what makes different petroleum fluids behave differently from a thermodynamic perspective. It will also describe the key measurable variables (molecular weight, specific gravity, and normal boiling points) – i.e. the distillation properties, and how these can be used to estimate the key model parameters (critical pressure, critical temperature, acentric factor, and volume shifts) – i.e. the EOS properties. The following articles will cover how to estimate and correlate the distillation properties to honor available measured data, while honoring the thermodynamic and physical constraints. Finally, several methods for estimating the EOS properties are given and a discussion of the results and following steps needed in the fluid model development are given.
The goal of this series of articles is not to be an academic exercise in fluid model development, but rather a practical framework for engineering tasks. For this reason, we have provided real field data to be used throughout these articles. Example calculations and tasks related to the different methods will be given, and for you to get the maximum impact of these articles we suggest that you try to apply the methods and methodologies on the given datasets!
What Makes My Fluid Different from Your Fluid?
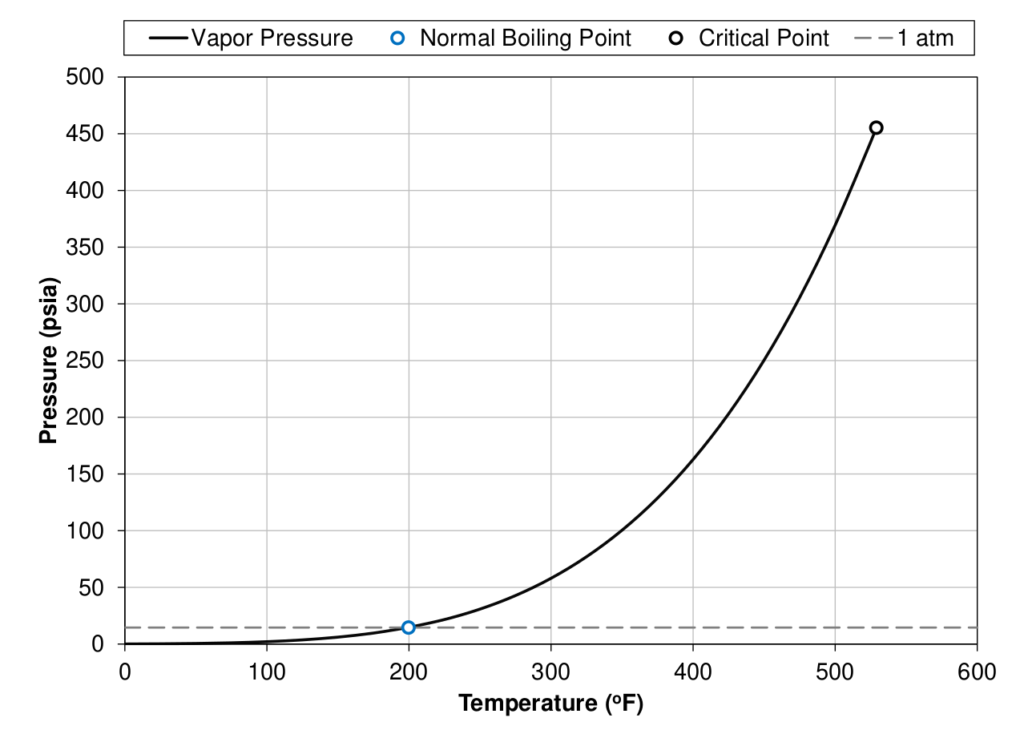
To define what makes different fluids behave differently, it is beneficial to first define some terminology that will make the classification of fluids easier. The first term that needs to be understood is a components normal boiling point (\(T_b\)). The normal boiling point is simply the temperature that a component starts boiling (phase transition from liquid to vapor) at atmospheric pressure (1 atm \(\approx\) 14.7 psia \(\approx\) 1.013 bara). The phase transition from liquid to vapor for a single component system is defined as the vapor pressure (\(p_v\)) and is a function of temperature. An example of the vapor pressure curve for a C7 component is shown in Figure 1. The normal boiling and an illustration of its definition is also shown where the grey dashed line crosses the vapor pressure curve.
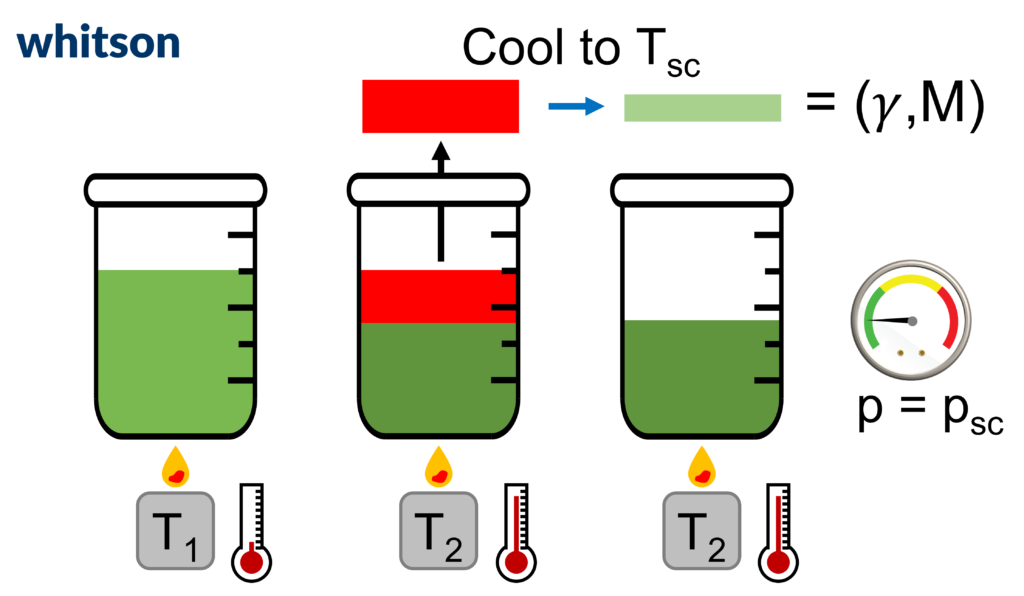
One major benefit of the normal boiling point definition is that it is a physical way of splitting components from a mixture in a consistent manner. The process of increasing the temperature slowly to remove components from a mixture is called distillation and can be a useful tool for characterizing petroleum fluids, as will be shown in the following articles. Because of the availability of the distillation data, it is convention to order components in a mixture by increasing normal boiling points. A figure showing the physical distillation process is given below.
The next terminology that needs to be defined is a single carbon number (SCN) component. Most petroleum SCN components are a collection of 10’s, or 100’s of hydrocarbon molecules that all have a normal boiling point between two neighboring normal paraffin components. Mathematically it can be stated as all components that have normal boiling point in the range
\(T_{b,nC_{x-1}}<T_b\le T_{b,nC_x}\)
(1)
The SCN group for a component in the range given by Equation (1) is said to be Cx where x is an integer.
Hydrocarbon mixtures are often reported with SCN components starting from heptane (C7) up to some upper component (for example C35), where the last component is a collection of all components with higher normal boiling point than the second to last normal paraffin (for example n-C35 for a C36+ plus fraction). This last component is referred to as a plus fraction (e.g. C36+ = {C36, C37, C38, …}).
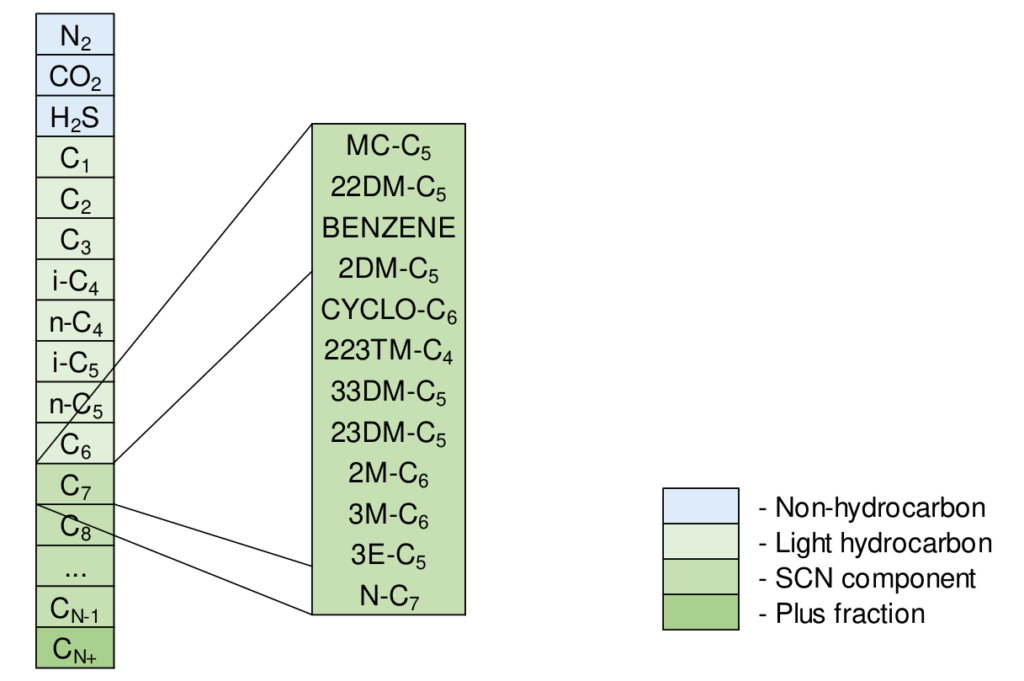
An example component slate with SCN components from C7 to the plus fraction component (CN+) is given in Figure 3. It is convention to add the non-hydrocarbon components before the hydrocarbon components although this violates the normal boiling point ordering. Figure 3 also shows how the SCN C7 component is in reality a collection of several compounds with normal boiling points between normal hexane (n-C6) and normal heptane (n-C7): 155oF to 209oF.
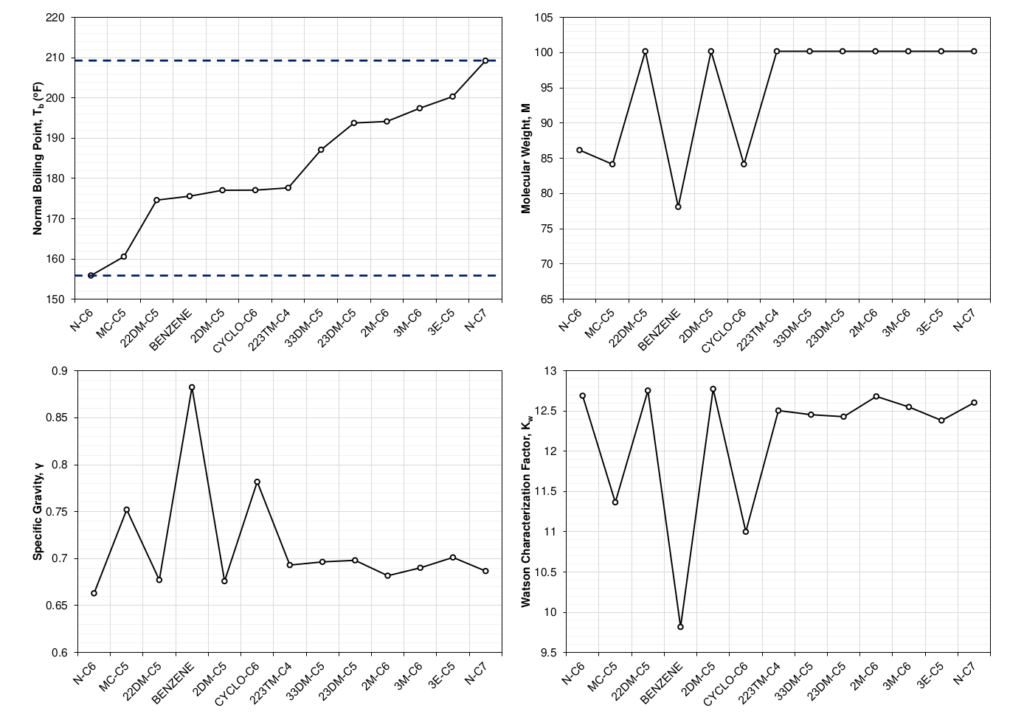
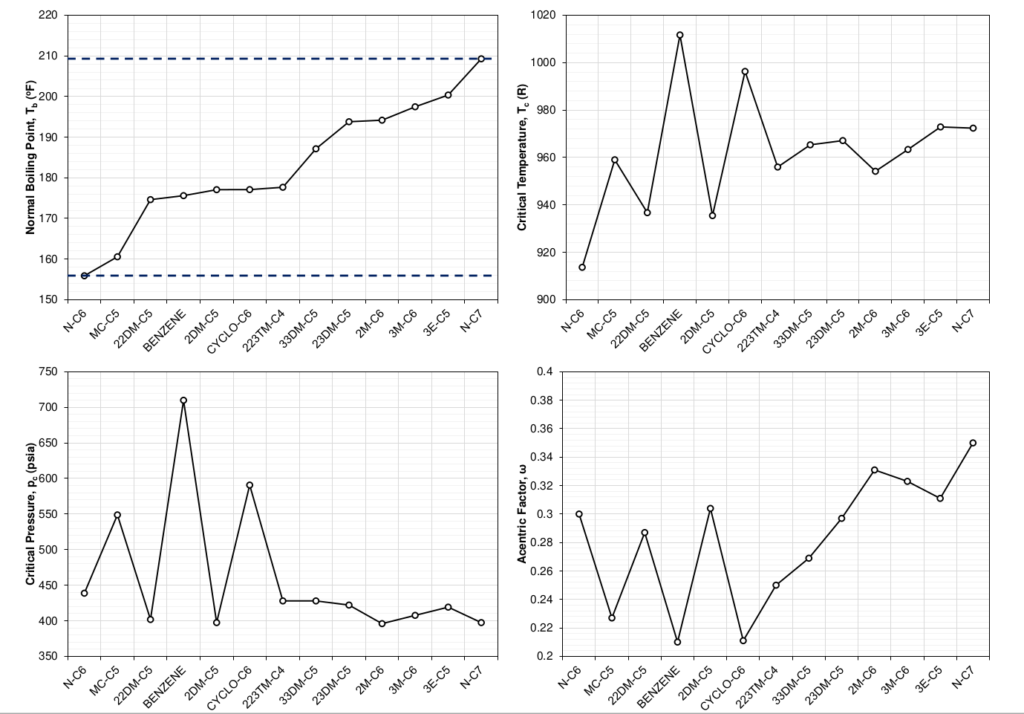
Figure 4 shows the distillation properties for the molecules that are grouped into the SCN C7 component. It is interesting to note that the number of carbon atoms for several of the molecules in the SCN C7 component is less than 7 (down to 5). This makes the term SCN slightly misleading and has (sadly) resulted in widespread misunderstanding what SCN represents.
Based on the three component properties shown in Figure 4, many attempts have been developed that try to characterize the components based on the distillation properties. The Watson characterization factor (\(K_w\)) [1,2] is one well known example. Whitson [3] expressed the Watson characterization factor in terms of molecular weight and specific gravity by
\(K_w=T_b^{1/3}/\ \gamma \approx 4.5579\cdot M^{0.15178}\gamma ^{-0.84573}\)
(2)
based on a correlation by Riazi and Daubert for \(M=f(T_b,\gamma\)). The magnitude of Kw. A value close to 10 indicates that the component is aromatic, close to 11 indicates that the component is naphthenic, and above 12 indicates that the component is paraffinic. Paraffinic components are long chained molecules with low density, high molecular weight, and high normal boiling points relative to their SCN group, where aromatic components are cyclic (round) components with high density and low molecular that usually have lower normal boiling points relative to their SCN group. The naphthenic components are somewhere in between these extremes. The distribution of paraffinic, naphthenic, and aromatic (PNA) components is often referred to the PNA distribution and will be discussed in more detail below.
The component properties in Figure 4 are possible to measure in bulk but are not the properties used to describe the phase behavior in a thermodynamic model such as the cubic equation of state (EOS). The cubic EOS model needs the critical temperature (\(T_c\)), critical pressure (\(p_c\)), acentric factor (\(\omega\)), and volume shifts (\(v_s\)) to perform any thermodynamic calculations. The spread of these component properties for the molecules in a SCN C7 component are shown in Figure 5.
Comparing Figures 4 and 5, it is clear that there is a relationship between the properties. It is this relationship that allows for the use of correlations between the distillation properties shown in Figure 4 for petroleum mixtures and the EOS properties needed for the thermodynamic calculations shown in Figure 5.
The definition of a SCN component results in some physical constraints. The first constraint is that the SCN normal boiling point must be within the constraint given in Equation (1). This is a strict constraint that should be honored. This constraint becomes stricter for heavier SCN components, which helps in limiting the tuning that can be done for the EOS modeling. The second constraint is that the molecular weight has a strict upper bound defined by the SCN (\(I\)) and is the upper normal paraffin bound. The equation for the upper bound is given by
\(M\leq M_{upper}=14.0269\cdot I+2.01588\)
(3)
where \(I\) is the single carbon number.
The distribution of the molecules that make up a SCN component is the sole reason for the difference in component properties. This can be shown by doing the exercise of picking a distribution of a SCN component’s sub-components and showing how the averaged component properties of the SCN component change. Figure 6 shows how a distribution of 100% normal heptane would give the SCN C7 component the same EOS properties as normal heptane. This limiting case would hold for any pure component. Figure 7 shows a slightly more interesting case, where an exponential distribution weighted towards the paraffinic components was chosen. The shift in EOS average properties were calculated using the distribution and a mixing rule that ensures that the cubic EOS a and b parameters remain the same as the mixture a and b parameters for all temperatures.


What is Heptane Plus (C7+) Characterization?
From the previous section, the main take aways should be that there is not a unique, generalized SCN for C7 or any of the other heavier SCNs, and certainly not for the heaviest plus fraction (e.g. C36+). This is because of the vast number of compounds that either cannot or is not measured which make up the heavier fraction of petroleum mixtures. This difference in SCN average properties is what makes different fluids behave differently. Characterizing the most appropriate average properties for each of the C7+ SCN fraction (and the heaviest CN+ fraction) of the mixture is therefore crucial for accurately predicting the phase behavior of different fluid systems. This process is called heptane plus characterization (or C7+ characterization).
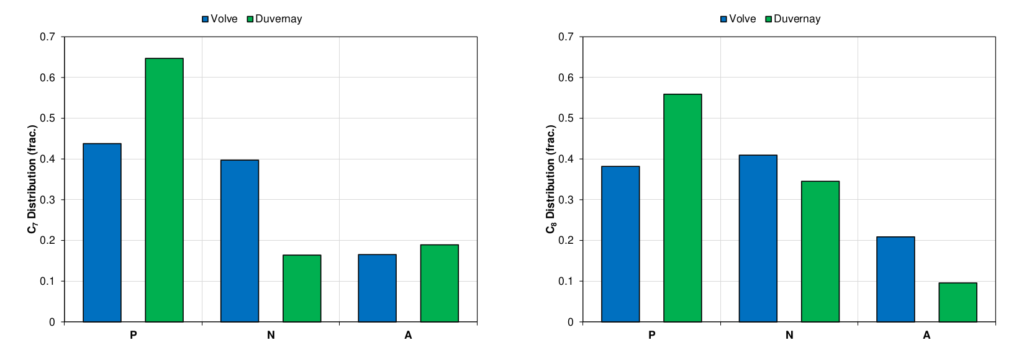
So, what is the goal of the C7+ characterization? Conceptually, the goal is to establish C7+ SCN and plus fraction properties that properly reflect the PNA distribution for petroleum mixture from the available data. The following articles will go into more detail of how this can be done and what data can and should be honored to give an accurate characterization. One type of data that indicates the difference between different PNA splits for different fluid systems is the C7, C8, and C9 SCN component splits measured in the laboratory. This analysis is often captured primarily by including a quantitative description of aromatics for SCN fractions C7, C8, and C9 using BTX (from benzene, toluene, and xylene) component analysis. This analysis for C7 and C8 is shown for a volatile oil sample in from the Duvernay basin in Canada and a black-oil sample from the Volve field in Norway. This data is shown in Figure 8 and indicates that the Duvernay fluid has a higher paraffin content for these components.
What is the Output of This Work?
The goal of our proposed C7+ characterization procedure is to (1) relate the distillation properties (γ, M, Tb) using available measured data, (2) use the correlations to estimate specific distillation properties for the SCN components, and (3) use the distillation properties as a basis to estimate the EOS properties (Tc, pc, ω, vs) from correlations and physical constraints. These properties will be the starting point for the EOS model tuning.
So, what are the benefits of the proposed methodology if the next step is EOS model tuning? The simple answer to this question is that whenever you are trying to solve a regression problem, typically better to start closer to the solution. If you are not convinced by this reasoning (perhaps your interest is in the PVT more than the regression), another key reason is that the proposed approach forces the person developing the fluid model to honor the C7+ characterization data. Additionally, starting with a good description of the C7+ characterization data will, in most cases, result in less tuning being needed to get a good match for a wide range of fluid types (from wet gases to black-oils) in the larger fluid system (e.g. field or basin). But you shouldn’t blindly take our word for it, and our goal is that at the end of this article series you will see examples with real data that will convince any reasonable skeptic!
What’s Coming Next?
The progression of the following articles will follow the proposed C7+ characterization methodology. The first relationship needed is the distillation properties (γ, M, Tb). This relationship is the basis for estimating the SCN molecular weight correlations and the initial estimates for the lower molecular weights in the gamma molar distribution model. The second topic will be how the distillation properties relationship can be used in correlations to estimate the SCN component molecular weights that honor the C7+ characterization. Following the molecular weight correlations, the next topic is the gamma molar distribution model, its parameters, how to develop a multi-sample model and what it can be used for. With the gamma molar distribution model and SCN component molecular weights, the next article covers how to estimate the SCN component specific gravities and normal boiling points. Finally, the last article will cover how to estimate the SCN component EOS properties based on the distillation parameters.
With the road ahead planned, all we need to do is buckle up and enjoy the journey. The road ahead is long and requires some detours and covering several complicated topics, but the result will hopefully end with a deep understanding of how you can accurately predict and describe your fluid system’s C7+ character!
Thanks for reading!
References:
[1] Watson, K.M. and Nelson, E.F. 1933. Improved Methods for Approximating Critical and Thermal Properties of Petroleum. Industrial and Engineering Chemistry 25 (1933): 880.
[2] Watson, K.M., Nelson, E.F., and Murphy, G.B. 1935. Characterization of Petroleum Fractions. Industrial and Engineering Chemistry 7 (1935): 1460–1464.
[3] Whitson, Curtis H. “Characterizing hydrocarbon plus fractions.” Society of Petroleum Engineers Journal 23, no. 04 (1983): 683-694.
###
Learn more about our software products
Global
Curtis Hays Whitson
curtishays@whitson.com
Europe
Mohamad “Moe” Dahouk
dahouk@whitson.com
Asia-Pacific
Kameshwar Singh
singh@whitson.com
Middle East
Ahmad Alavian
alavian@whitson.com
Americas
Mathias Lia Carlsen
carlsen@whitson.com
About whitson
whitson supports energy companies, oil services companies, investors and government organizations with expertise and expansive analysis within PVT, gas condensate reservoirs and gas-based EOR. Our coverage ranges from R&D based industry studies to detailed due diligence, transaction or court case projects. We help our clients find the best possible answers to complex questions and assist them in the successful decision-making on technical challenges. We do this through a continuous, transparent dialog with our clients – before, during and after our engagement. The company was founded by Dr. Curtis Hays Whitson in 1988 and is a Norwegian corporation located in Trondheim, Norway, with local presence in USA, Middle East, India and Indonesia
