By: Mathias Carlsen
I’m personally a fan of using all the “tools in the toolbox” when analyzing well performance.
In whitson+, that includes,
- Decline Curve Analysis (DCA)
- Flowing Material Balance (FMB)
- Analytical Rate Transient Analysis (ARTA)
- Numerical Rate Transient Analysis (NRTA)
- Numerical Model
They should all tell a story. And a consistent analysis would tell a consistent story.
BUT each method has its own strengths, weaknesses, and assumptions.
And those are important to understand.
In the text below, we go through these in detail.
BUT if you want the short story, here it is
- Run DCA as a first pass.
- FMB assumes BDF.
Hence, it will always represent a conservative estimate of the contacted pore volume (Vp). - If DCA EUR and FMB Vp estimates are similar, it can indicate infinite acting, or transitional flow.
- Don’t use analytical RTA to resolve estimates of contacted pore volume, or other reservoir parameters.
Use it primarily for flow regime identification, and to calculate rate normalized pressures (RNPs = (pi-pwf)/q) or pressure normalized rates (PNRs = q/(pi-pwf)). - Ensure that the contacted pore volume (Vp) in Numerical RTA (numerical model) is larger (if infinite acting/transitional) or equal (if BDF) to the contacted pore volume resolved from FMB.
Flow Regimes
Before going systematically through each “tool” in the “toolbox”, let’s repeat the flow regimes.
1. Infinite acting flow, often referred to as transient flow, is the flow regime that ends as the pressure transient reaches one reservoir boundary.
2. Transitional flow is the flow regime that starts as the pressure transient reaches one reservoir boundary and ends when the pressure propagation reaches all reservoir boundaries.
3. Boundary dominated flow, also called pseudo-steady state, is the flow regime that starts when the wellbore pressure response is affected by all reservoir boundaries.
Decline Curve Analysis

This is always the first thing to do.
It comes from Fetkovich actually; “Always look at rate-time data first”.
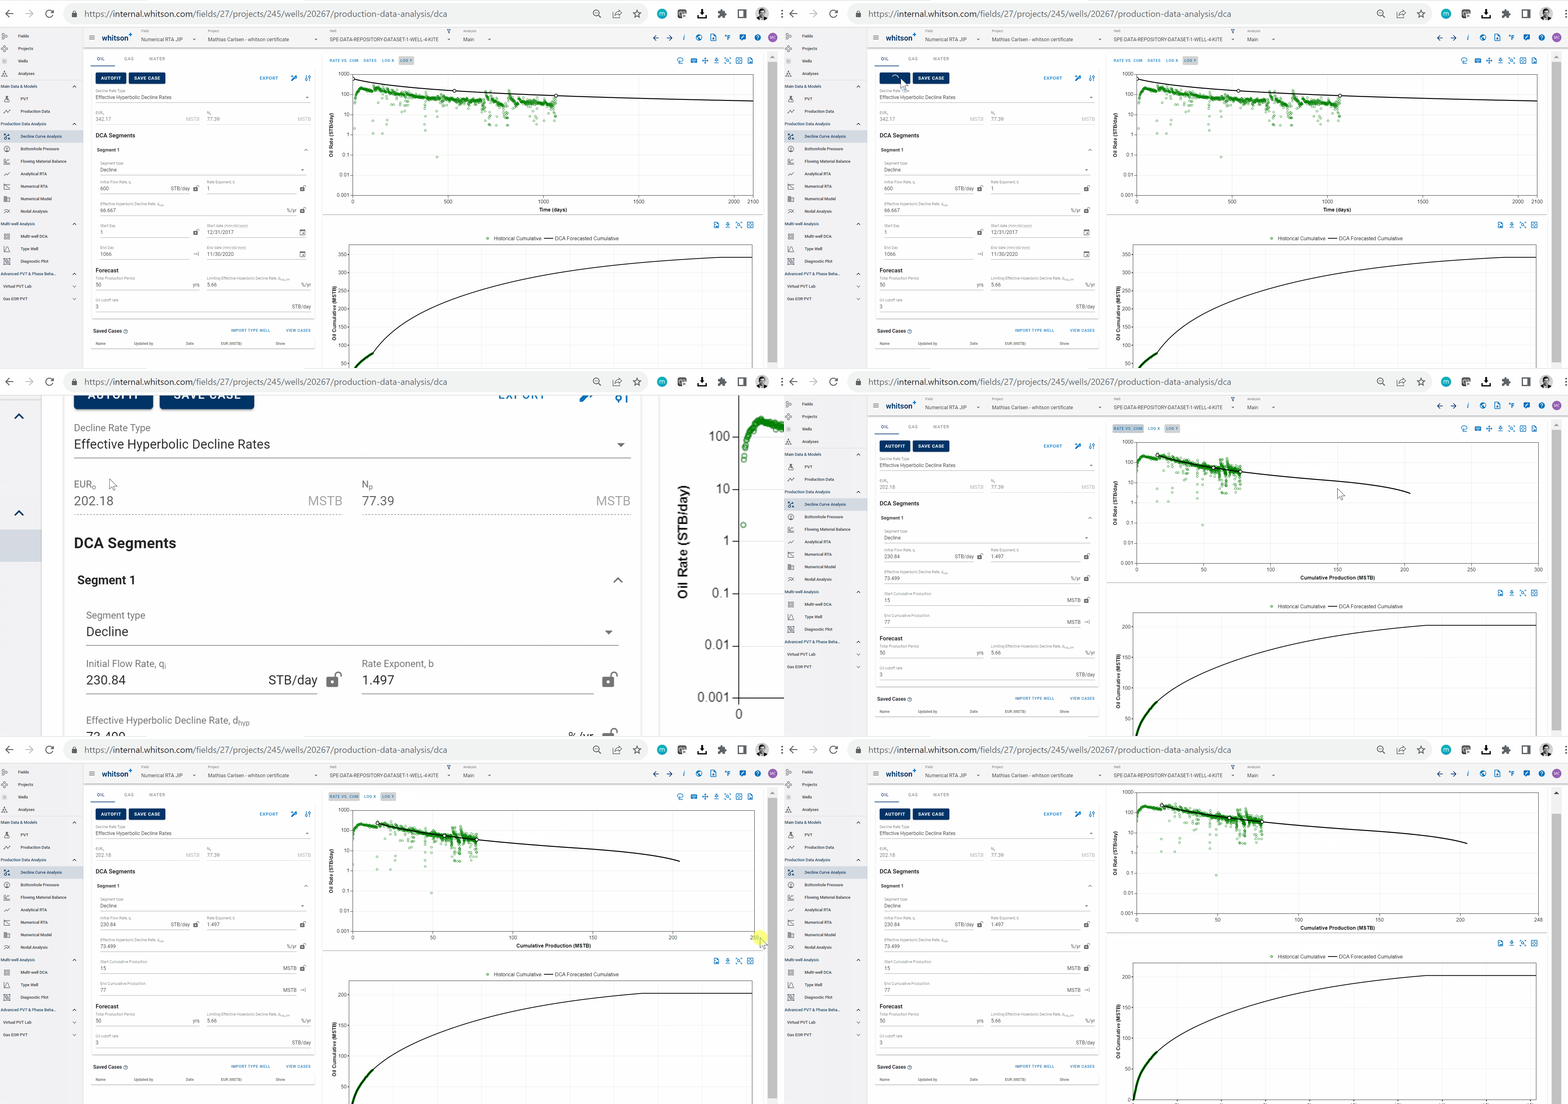
I personally always start with the autofit and like to toggle on the “RATE vs CUM”.
Why? I guess I’m just a “RATE vs CUM” kind of guy.
For this example, the autofit yields an oil EUR of 200 MSTB.
Of course, DCA doesn’t account for changes in bottomhole pressure, but it’s an awesome first pass to bracket your answer.
Strength: fast.
Weakness: doesn’t account for changes in flowing bottomhole pressures, or “physics” (e.g., boundaries / “size of the tank” etc.).
PS! Remember that DCA can be tied to something “physical”, as long as the bottomhole pressure is constant(ish).

Flowing Material Balance
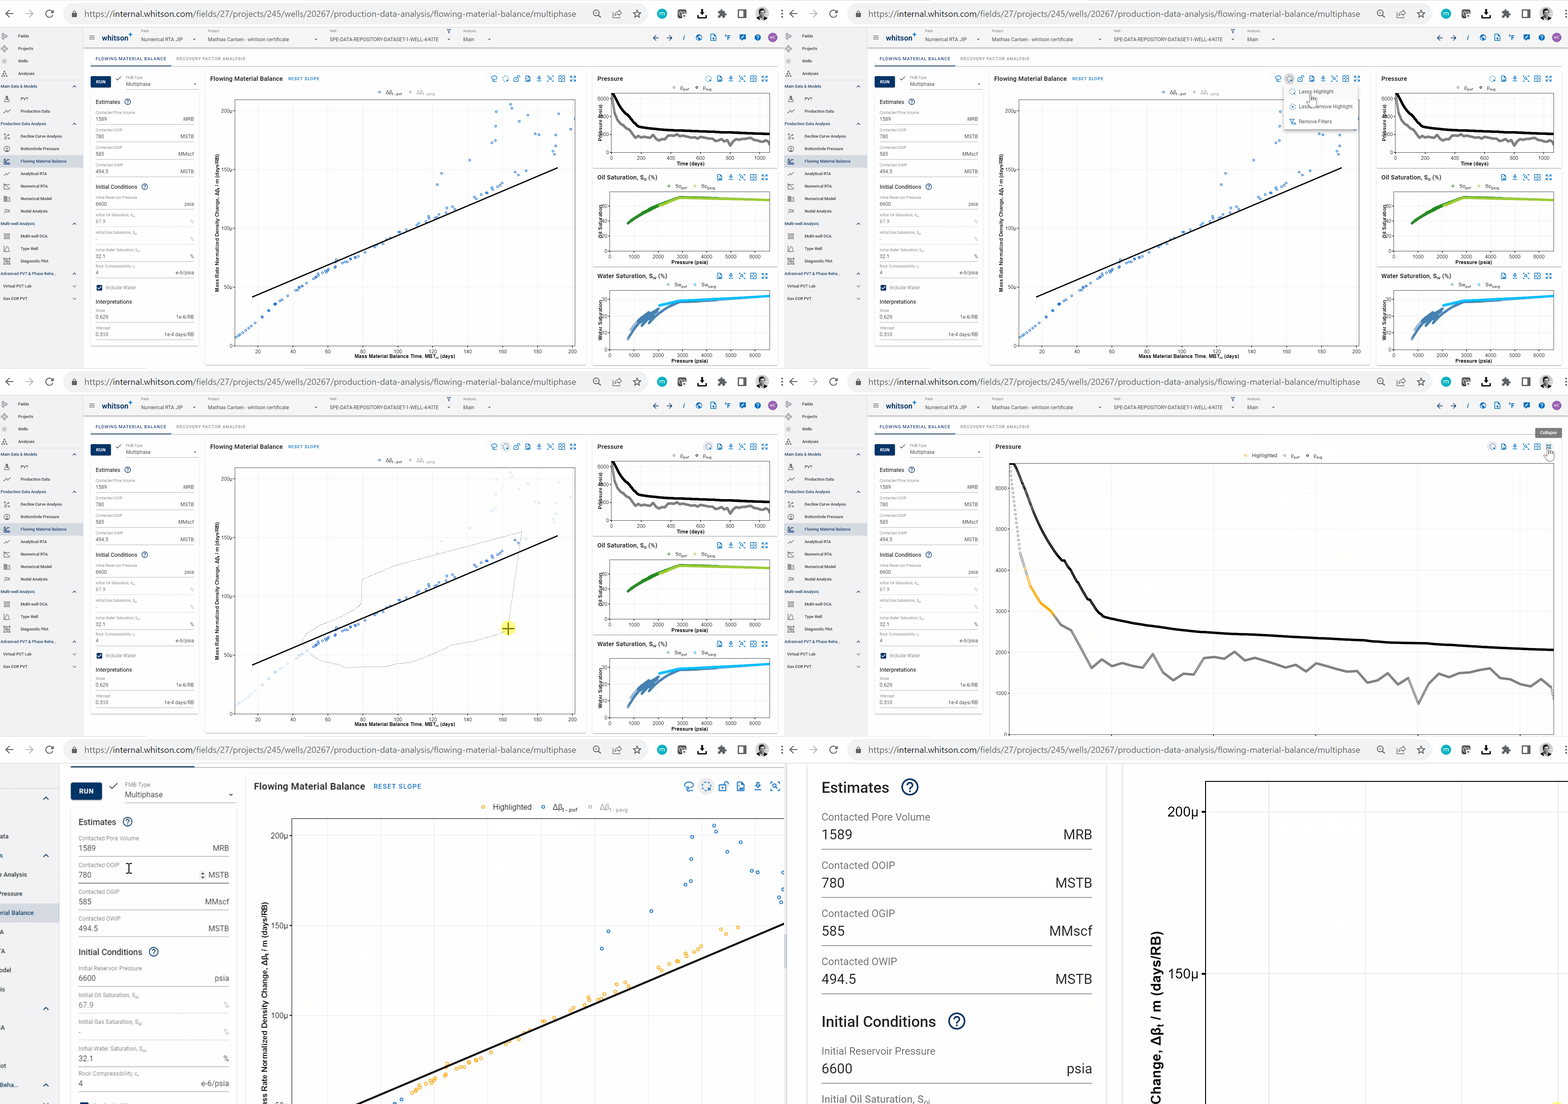
The objective of a flowing material balance (FMB) method is to resolve a well’s contacted pore volume, i.e. contacted OOIP or OGIP.
BUT the method assumes full boundary dominated flow (BDF).
That is true for Blasingame FMB, Agarwal FMB and Thompson-Ruddick FMB. All of them.
And it makes sense … if your job is to estimate the size of the tank, but you are in a flow regime where you are not “feeling” the whole tank yet (by definition), how can you do it? It’s IMPOSSIBLE.
It’s like asking someone to estimate the size of a pitch-black room before their flashlight has pointed at all the walls yet.

In other words, a FMB method will ALWAYS resolve a conservative pore volume due to the BDF assumption.
Some folks would argue to not use FMB methods if the well is still infinite acting or transitional.
I don’t agree with that.
If you are still infinite acting, or transitional, you’ll obtain a LOWER estimate of your contacted pore volume. You can leverage this to bound your RTA work on the low side.
In addition, if your DCA estimates and FMB results are similar (would mean 100% RF), it’s another strong indication that your well is in fact infinite acting or transitional.
This is another data point to support your flow regime interpretation. And trust me, with noisy production data, that is worth its weight in gold.

In this example, the resolved contacted OOIP is 780 MSTB. This is much larger than the DCA EUR of 210 MSTB. So, we’re all good here.
Strength: fast and accounts for physics.
Weakness: assumes boundary dominated flow.
Analytical RTA
To obtain contacted pore volume, or any reservoir property, I would NOT use analytical RTA.
Not even for “single phase” cases (e.g. dry gas).
Why?
The method doesn’t account for the combination of superposition and PVT/multiphase flow effects.
A simple way to highlight this is to look at the equation for time to end of linear.
The PVT properties used are evaluated at initial reservoir conditions.

In reality, some kind of pressure weighted average property should be used.
This topic is also discussed by Agarwal in his 1979 paper on “Real Gas Pseudo-Time”
“The question arises whether the (~μct) product should be evaluated at (1) the initial reservoir pressure, (2) the final flowing pressure prior to shut-in, or (3) some average pressure. Results of this study indicate that the use of anyone of the above three pressure levels is less than satisfactory.”
So … I know what you’re thinking; “why do we even have the option to resolve parameters in analytical RTA part of the software?”
The answer is simple. As a software vendor, we must accommodate different needs and opinions.
It’s also a common functionality in other industry standard tools, hence, we offer it for familiarity.
At the same time, the interface provides excellent flow regime diagnostic plots.
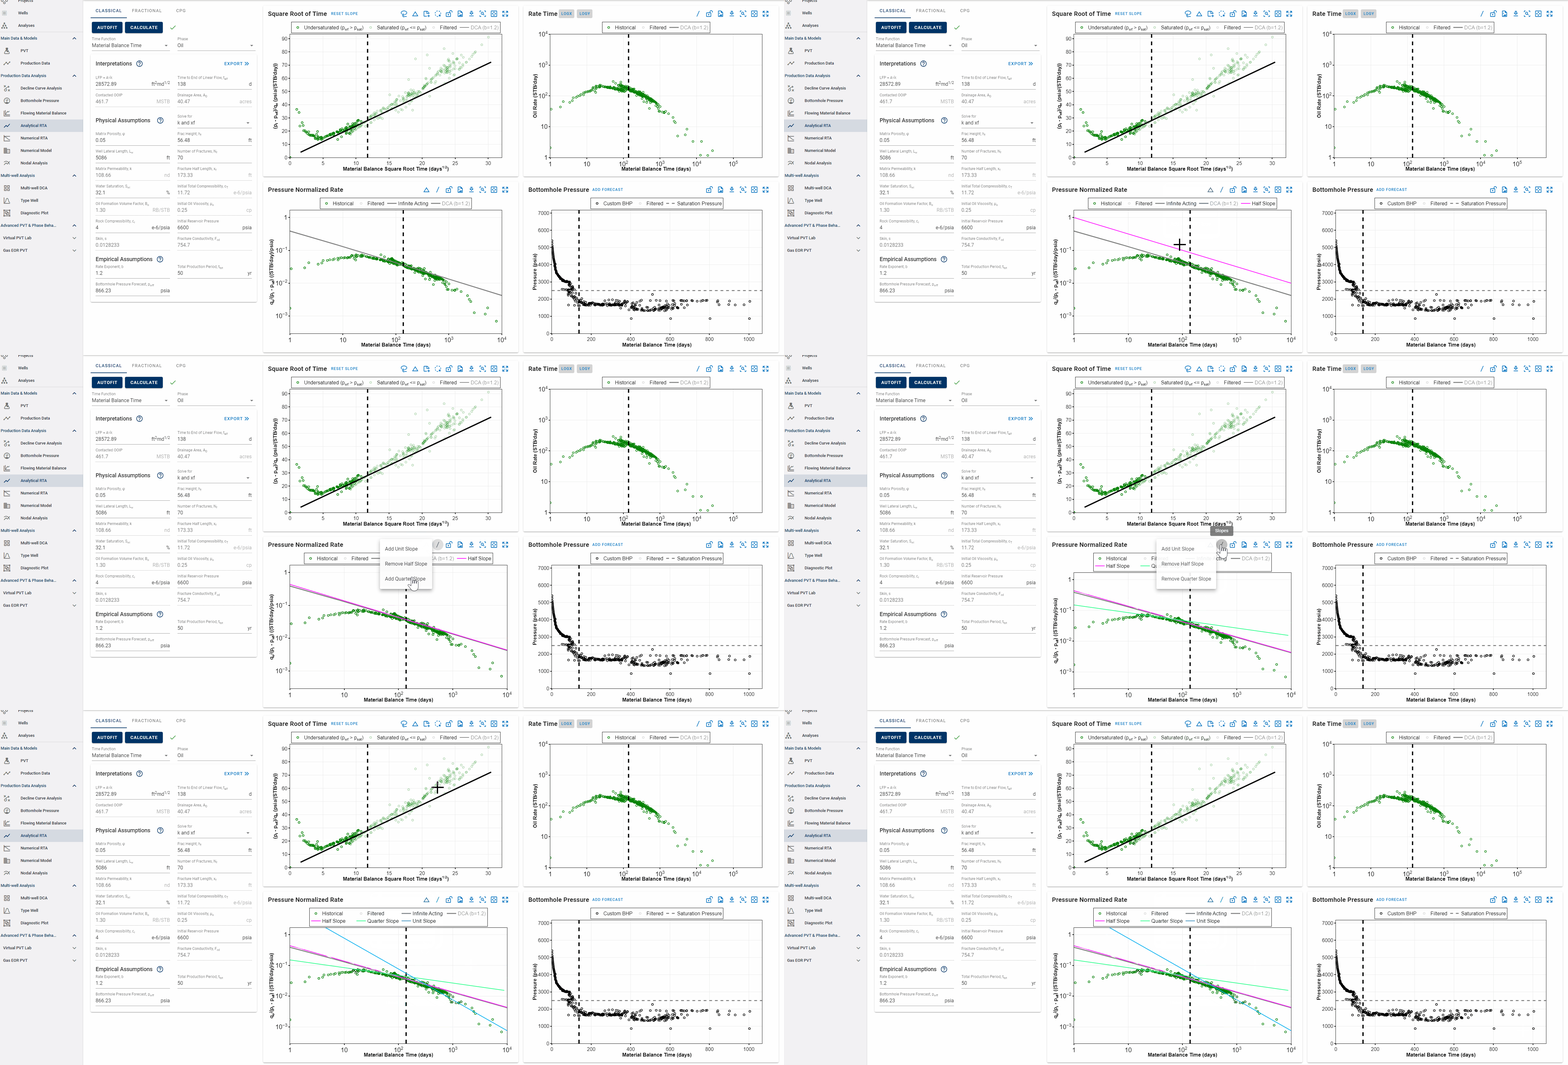
For instance, in the PNR plot (in material balance time), a half slope indicates infinite acting (IA) linear flow. A unit slope indicates BDF.
But be careful – the combination of superposition and multiphase effects can skew your flow regime interpretation.
Furthermore, the superposition time function used will always “bias” your interpretation. In many situations, using square-root-time superposition makes the data look like linear flow, while using log-time makes it look like radial flow, and using material-balance-time makes it look like boundary dominated flow.
So, wait with your final flow regime conclusion after you’ve conducted the rest of the analysis.

Strength: fast and accounts for changing bottomhole pressure.
Weakness: analytical equations are too simple for most realistic reservoir conditions.
Numerical RTA & Numerical Model

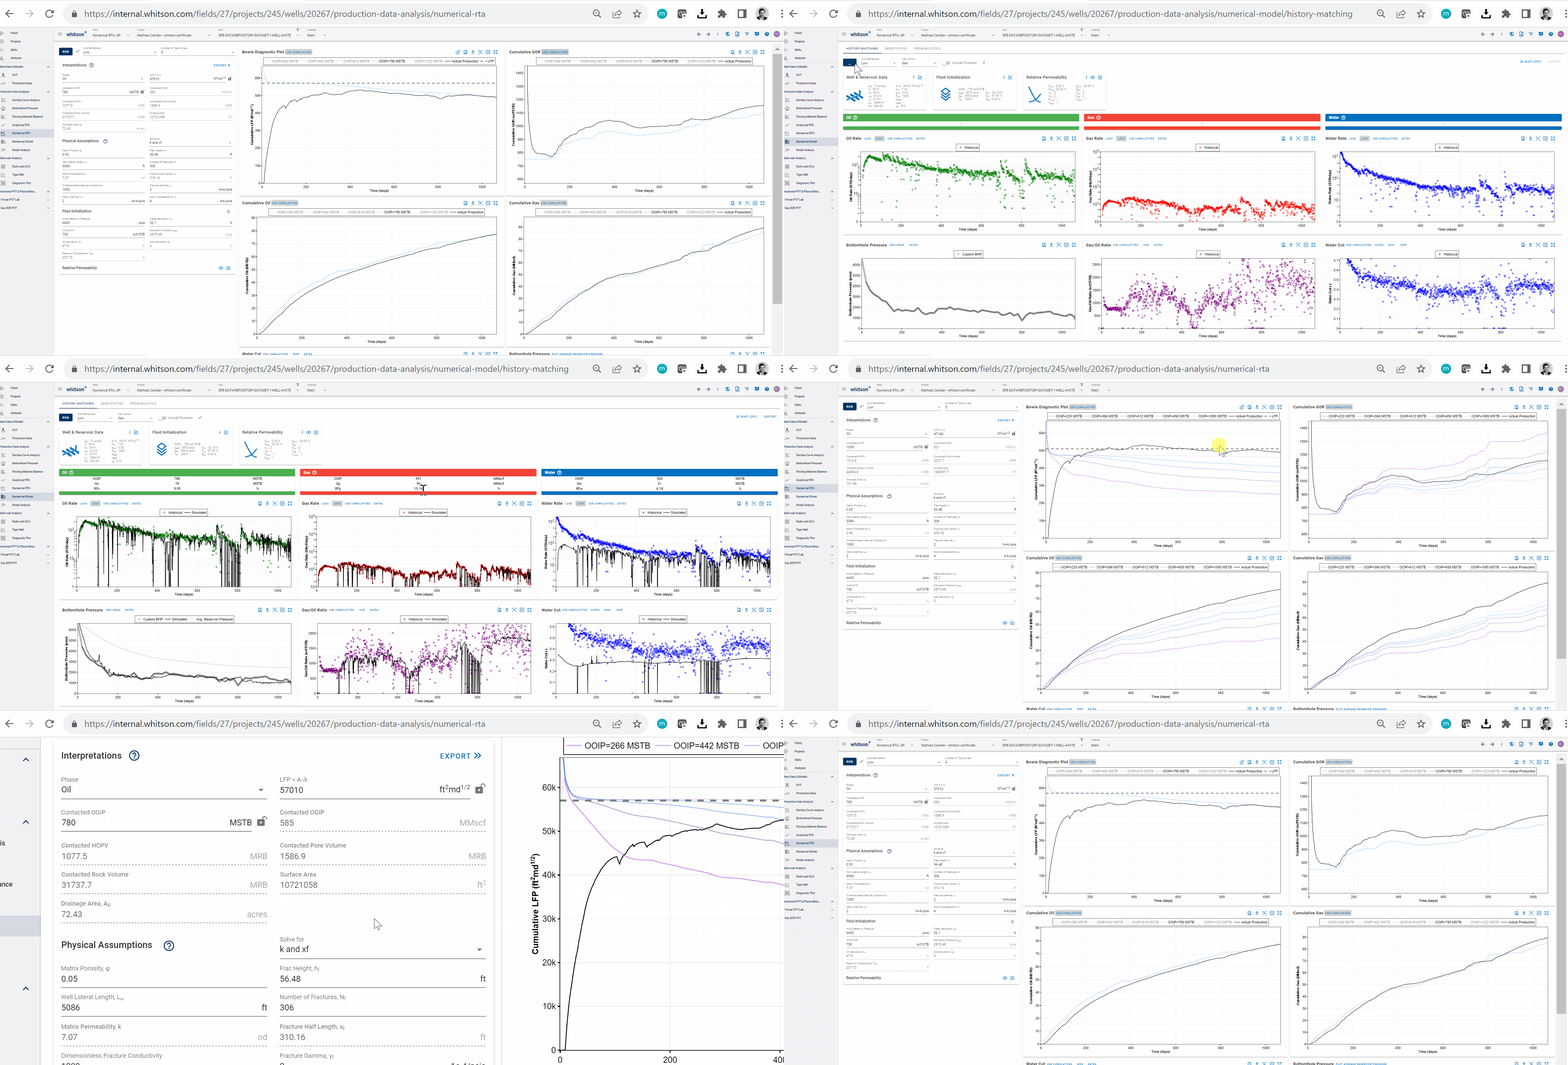
In numerical RTA, the most important consistency check is to make sure the resolved pore volumes (OOIP, OGIP, Vp) are equal to, or larger than, the pore volumes resolved from MFMB method.
In this case the contacted pore volume is similar to what I got in MFMB. So we are all good.
The beauty of numerical RTA is that it ensures consistency when you bring it into your numerical model.
If you use the export feature from NRTA, and have a good NRTA fit, you’ll get a great history match on the first go.
Strength: rigorous and accounts for the combination of superposition and multiphase flow effects.
Weakness: More time consuming. But still, very fast leveraging whitson+ and cloud computing (less than 10 minutes to complete the workflow for most wells).
PS! If you want to know more about NRTA, go here: https://manual.whitson.com/modules/well-performance/numerical-rta/#11-what-are-the-inputs-and-outputs-to-numerical-rta.
###
Contact carlsen@whitson.com to learn more about our software products.
Global
Curtis Hays Whitson
curtishays@whitson.com
Asia-Pacific
Kameshwar Singh
singh@whitson.com
Middle East
Ahmad Alavian
alavian@whitson.com
Americas
Mathias Lia Carlsen
carlsen@whitson.com
About whitson
whitson supports energy companies, oil services companies, investors and government organizations with expertise and expansive analysis within PVT, gas condensate reservoirs and gas-based EOR. Our coverage ranges from R&D based industry studies to detailed due diligence, transaction or court case projects. We help our clients find the best possible answers to complex questions and assist them in the successful decision-making on technical challenges. We do this through a continuous, transparent dialog with our clients – before, during and after our engagement. The company was founded by Dr. Curtis Hays Whitson in 1988 and is a Norwegian corporation located in Trondheim, Norway, with local presence in USA, Middle East, India and Indonesia
