Two common goals of Rate Transient Analysis (RTA) are the quantification of early time well performance using the Linear Flow Parameter (LFP), as well as Original Oil In Place (OOIP) volume being drained. These two parameters are essential for understanding the effects of completions, geology, and depletion which then advises different strategies for optimizing the economics of future development. Bowie & Ewert (2020) introduced an “Numerically Enhanced RTA workflow”, or “Numerical RTA” for short, in URTeC 2967. The proposed workflow leverages a reservoir simulator to estimate key RTA outputs (e.g., LFP and OOIPs), while rigorously accounting for superposition and multi-phase flow effects.
At ATCE 2021, we presented a paper (SPE 205884) that extends the workflow originally proposed by Bowie & Ewert (2020). What’s new compared to the original paper (URTeC 2967)? Well, if you don’t want to read the whole paper, these are the four highlights.
- First, we modify the LFP parameter to include porosity, i.e. LFP’ = LFP√φ. Why? See below.
- Second, we extend the methodology to all fluid systems, i.e. not only oil systems as was the main topic in the original paper.
- Thirdly, we extend the workflow to handle finite conductivity fractures (i.e. low Fcd values). The original paper assumed that the fractures were infinite conductive (i.e. a high Fcd).
- Lastly, we introduce the so-called “cumulative LFP” to reduce noise when working with real field data.
Why modify LFP to include porosity, i.e. LFP’ = LFP√φ?
Well, the short answer is that the three fundamental relationships that the numerical RTA workflow is based on is not true unless you include porosity. In other words, the following would not be true if we used just LFP, and not LFP’ (=LFP√φ).
“For a given fluid initialization (PVT and Swi), relative permeability curves, and bottomhole pressure profile versus time, the following three fundamental relationships exist between LFP’, OOIP, and well performance
- Wells with the same LFP’ yield the same well performance during infinite acting, linear flow.
- Wells with the same LFP’/OOIP ratio yield the same producing GOR and water cuts for all times (relative rates), regardless of the actual value of LFP and OOIP.
- Wells with the same LFP’ and OOIP yield the same well performance for all times and all flow regimes.”
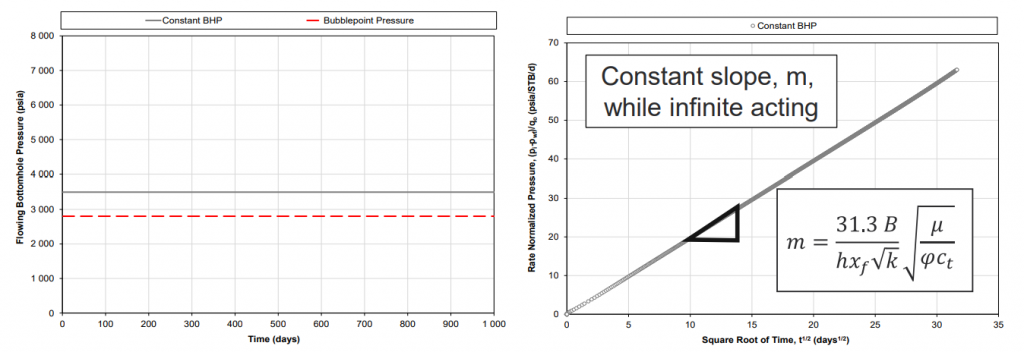
When the original paper presented these relationships, and the associated simulations, the porosity was kept the same in all the presented cases, so the effect of changing porosity was not observed (Fig. 10 in URTeC 2967). But if you run the same cases while porosity is being changed, you will see that it doesn’t hold up unless porosity is included in the LFP’ definition. This further leads to a practical disadvantage of not including porosity as a part of the LFP definition, as it would require your porosity to be a part of the input to the analysis. However, with the modified LFP’ you can perform your RTA analysis without assuming a porosity, and then input different porosity assumptions post your RTA analysis. This is great from an time/efficiency perspective, as an update of the porosity assumption, e.g. 6% vs. 7%, wouldn’t force you to redo all your RTA interpretation. And if you think about it, it makes sense if you are used to the traditional definition of the slope m – which is just a product of PVT properties (B, μ, ct) which are inputs to the analsysis, and LFP√φ which is an output.
This also manifests one of the key benefits of the proposed workflow, i.e., the decoupling of multiphase flow related data (PVT, initial saturations and relative permeabilities) from well geometry and petrophysical properties (𝐿, 𝑥𝑓, ℎ, 𝑛𝑓, 𝜑, k).
All Fluid Systems
The introduction of initial total formation volume factor (Bt) as defined here generalizes the workflow proposed by Bowie & Ewert (2020) to all fluid types, for both initially undersaturated and (two-phase) saturated conditions. For an undersaturated oil reservoir (Sgi = 0), Bt will simplify to Bo and for an undersaturated gas reservoir (Soi= 0) will simplify to Bo/rs. For a two-phase saturated case, the Bt will represent a saturation weighted oil FVF. Bt represents the ratio of a reservoir HCPV containing surface oil in a reservoir oil phase, a reservoir gas phase, or both phases.
Finite Conductivity Fractures
Sometimes an additional pressure drop in the fracture might be required to match historical observed data (e.g., GOR performance), and this can be included in the model by assigning a low dimensionless fracture conductivity (Fcd) to the model at hand. The lower the Fcd, the higher the pressure drop in the fracture. A finite conductivity fracture may be associated with a “linear GOR increase” when the flowing bottomhole pressure is below the saturation pressure. The physical reasons for this additional pressure drop can be many, but numerically a low Fcd will add extra pressure drop between the reservoir and the well. Wells that exhibit this behavior might qualify as clean-up candidates. To consistently incorporate a finite conductivity fracture into the numerically assisted RTA workflow, one needs to know how the definition of changes Fcd when other parameters change (e.g., permeability, height, number of fractures). Details of how that is done can be found here.
Cumulative LFP’
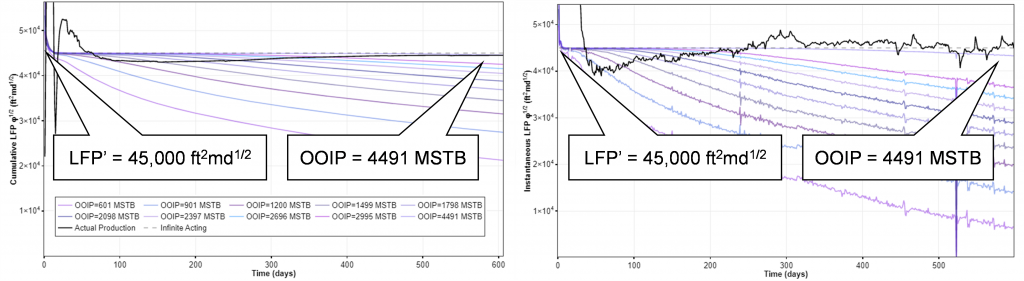
Bowie and Ewert (2020) originally proposed to calculate the daily LFP’ by using the ratio of daily rates (𝑞𝑎𝑐𝑡𝑢𝑎𝑙 / 𝑞𝑚𝑜𝑑𝑒𝑙), resulting in the instantaneous LFP’. Alternatively, one can use the ratio of cumulatives produced until a given day (𝑄𝑎𝑐𝑡𝑢𝑎𝑙 / 𝑄𝑚𝑜𝑑𝑒𝑙) to reduce noisy data, resulting in the cumulative LFP’
Want to know more about numerical RTA? We’ll check out this webinar: https://youtu.be/KOVZbissBXY
Download and read the whole paper here.
###
Learn more about our consulting capabilities
Global
Curtis Hays Whitson
curtishays@whitson.com
Asia-Pacific
Kameshwar Singh
singh@whitson.com
Middle East
Ahmad Alavian
alavian@whitson.com
Americas
Mathias Lia Carlsen
carlsen@whitson.com
About whitson
whitson supports energy companies, oil services companies, investors and government organizations with expertise and expansive analysis within PVT, gas condensate reservoirs and gas-based EOR. Our coverage ranges from R&D based industry studies to detailed due diligence, transaction or court case projects. We help our clients find the best possible answers to complex questions and assist them in the successful decision-making on technical challenges. We do this through a continuous, transparent dialog with our clients – before, during and after our engagement. The company was founded by Dr. Curtis Hays Whitson in 1988 and is a Norwegian corporation located in Trondheim, Norway, with local presence in USA, Middle East, India and Indonesia